A trader's stress management plan:
1. Stay calm. Never trade position sizes that cause you increased anxiety. Stay within your comfort zone.
2. Keep perspective. Keep in mind that a single losing trade does not constitute a failure. If you are risking 1% of your trading capital, it should be on only one of the next 100 trades.
3. Stay comfortable. Make sure you are physically comfortable and relaxed while trading. Good posture, proper ergonomics, eating and drinking well, and staying mindful of your wellness are all critical to your success.
4. Visualize. Your future success is based on your current discipline and your ability to focus on trading your system. Visualize your success, and it will come.
5. Slow down. Only take your best entries and setups. Most stress comes from trying to make things happen when the odds are against you.
6. Appreciate. Being thankful for your family, friends, hobbies, and outside interests will help keep your trading in perspective.
7. Be mindful. Pay attention to your emotions and mental processes. Watch them rise and fall, and rather than being a captive of your internal narrative, step back and observe it. This will create a space of equanimity.
8. Abandon stubbornness. Focus on your trading strengths and do more of that every day. Stop devoting time to the things that cause financial losses and mental or emotional pain.
9. Conquer your emotions. Stop making trading decisions based on fear or greed. Instead, focus on your trading plan and commit to acting only on facts, not mental fiction.
10. Move on. Be willing and able to exit and cut your losses when you are wrong. Move on to the next trade, knowing that each one is a new beginning.
REINTRODUCING: The ICT First Presentation Value Gap, FVG Model
The Only ICT AM Session Model With A 200% Win-Rate
ONE MODEL FOR LIFE — You Do NOT Need Anything Else!
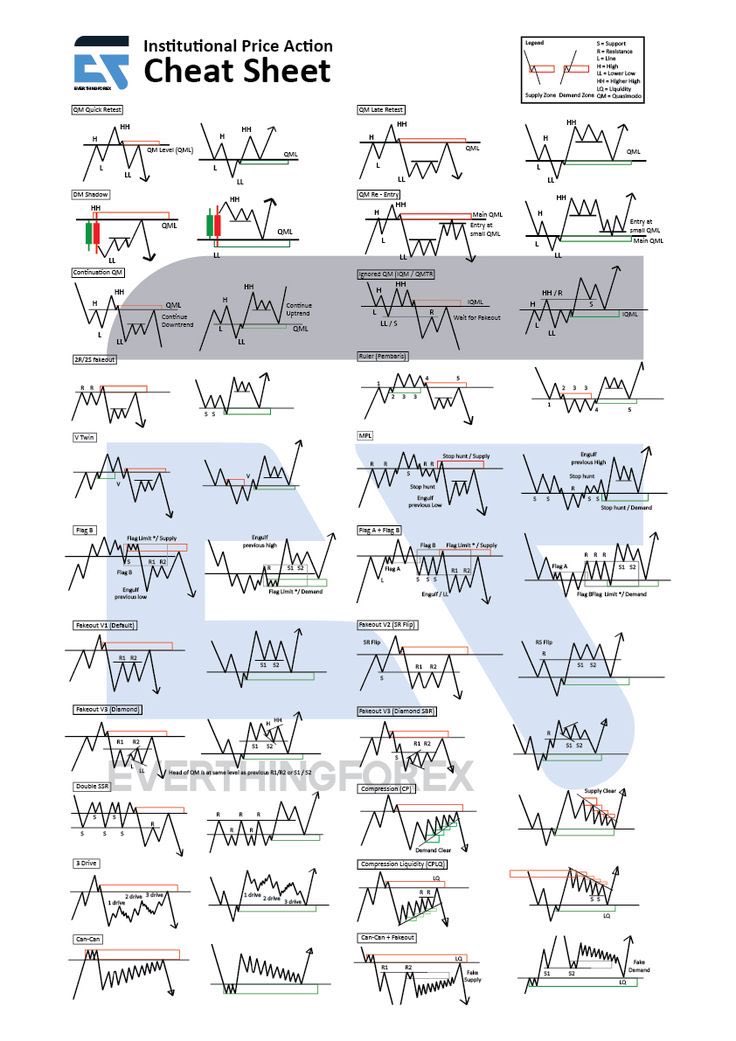
Institutional Price Action Cheat Sheet 2025
1. Market Structure
HH (Higher High) → Bullish continuation
HL (Higher Low) → Confirmation of strength
LH (Lower High) → Bearish continuation
LL (Lower Low) → Confirmation of weakness
2. Liquidity Zones
Equal highs/lows = liquidity pools
Stop hunts happen before real moves
Institutional orders hide below/above obvious levels
3. Order Blocks
Bullish OB → Last down candle before an impulsive move up
Bearish OB → Last up candle before an impulsive move down
Retest of OB = high-probability entry
4. Fair Value Gaps (FVG)
Imbalance between buyers & sellers
Price gravitates to fill gaps before continuation
5. Institutional Entries
Break of structure (BOS) + Retest = safest entry
Entry near liquidity sweep = sniper trades
Confluence of OB + FVG + BOS = institutional precision
6. Risk Management (The Real Edge)
1–2% per trade, never more
Stop hunts are normal → place stops smartly
Patience > entries — institutions wait, so should you
Golden Rule 2025:
Retail chases moves. Institutions create moves. Trade with the creator, not the chaser.
CRT A+ Setup Checklist
A high-probability CRT setup is built on the following six elements:
° Understand the prevailing order flow.
° Identify the correct trading range.
° Locate the CRT at the range high or range low.
° Wait for the proper CRT timing.
° Execute during the optimal purge timing.
° Use a key level for confirmation and execution.
A trader turned $5,000 into $53 million, and the discipline behind it is the opposite of what you'd expect.
He never had more than 10% of his net worth in his trading account. When it grew too big, he pulled cash out and reset. When he nearly blew up, a million down to 500K, he took 400K off the table and kept going.
Lance Breitstein made nearly $100 million as a prop trader. Back-to-back 8-figure years at Trillium. Then in 2022 he stepped back.
Not because his trading was failing. Because more millions wouldn't change his life, and time with family and health would.
If I charged $5,000 for this ICT model, it would still be cheap. Instead, I'm giving it away for free. Master it before 2026 ends and watch what happens to your results.
Retweet it. Bookmark it
How hedge fund quants do High Frequency Market Making & extract edge from every large order in the market is revealed in this 1 hour free lecture. Bookmark now.
It’s Not a Discipline Problem. It’s a Pressure Problem.
When everything depends on one account, every decision feels like life or death. You hesitate, you rush, or you exit too soon.
Successful traders eliminate that pressure.
Ready to trade alongside the pros?
🔗 Go to https://t.co/khZOx5eVsv to get started today!
Risk warning: Trading CFDs involves a high level of risk.
Most traders think Market Volume Profile is just POC, VAH, and VAL. That’s why they never really understand what the market is doing.
This 30-minute video goes far beyond the basics.
It breaks down Auction Market Theory, Market Profile mechanics, buyer/seller behavior, trend pressure, time-based structure, and high-probability action points in a way you can actually apply on your chart.
Inside this video you’ll learn:
• How to read market sentiment through time instead of emotion
• How to identify the trend for the day, week, and month
• The price levels that truly matter
• Different profile formations and what they mean
• How to spot high-probability setups using structure and value
• How multi-timeframe profiles guide entries and targets
If you’ve been plotting Volume/Market Profile without real understanding, this will change how you see price.
🎥 Full breakdown attached.
Most traders use ICT. Some use CRT. Very few combine them with Volume Profile.
That’s where the real edge is.
In this lecture, a break down pf how ICT/CRT combined with Volume Profile brings insane precision to your analysis is done.
You’ll see how:
• ICT liquidity concepts align with high-volume nodes
• CRT range logic fits perfectly inside value areas
• Volume helps you see where manipulation actually ends
• Acceptance and rejection (failed Auction) guide your entries
• You stop guessing and start reading real participation ICT shows you where price wants to go, CRT shows you how the range is built.
Volume Profile shows you where business is happening.
Put together, your chart stops looking noisy and starts making sense. Your analysis becomes surgical.
🎥 19-minute in-depth breakdown attached.