"My rent might go up next year"
"I am worried about oil prices"
You have views about where the world is going, and worries about what's coming. By utilizing prediction markets, Thalamus turns them into real positions, in plain language. No tickers, spreads, or expiries.
We're doing a limited release today for 1,000 users. Each user gets $10 to spend, so you can try Thalamus immediately.
https://t.co/XDtDevELYx
Today we’re launching personalized feeds for everyone: a live, personal view into what the smartest builders are paying attention to right now, tuned to your interests.
Track emerging ideas before they hit the mainstream. Read it on your dedicated feed page or get it delivered straight to Telegram.
Log in, tell us what you care about, and our system handles the rest.
Vibe code your own insider-detection dashboard, whale tracker, copy-trading system, or market forensics engine on top of Polymarket. Or build something nobody's thought of yet.
We just shipped the most powerful Polymarket analytics API in existence.
Per-wallet PnL, unrealized positions, win rates, hold durations, category breakdowns, and filterable leaderboards.
Every combination of filters is a different product. Here's what you can build with one API call: 👇
We rebuilt Kiyotaka for v4.0. Still 100% free to use for all chart enjoyers.
This is the biggest product release we’ve shipped yet:
a complete redesign, major UI/UX upgrades, new search, new chart types, better tooling, faster performance, new color themes, and a much improved execution interface. With more coming next week.
But v4 is bigger than a feature drop. Kiyotaka now feels faster, clearer, and much more intentional to use.
This marks a major turning point in how Kiyotaka works and where it’s going next.
Whether you are a builder, exchange or solo dev, if you want to try out world-class charting that beats TradingView and takes 30 seconds to set up, reach out to the guys at @percept_labs
When we invested in @davidyjeong and @tread_fi, the thesis was simple: a founder with rare technical depth, relentless execution, and a genuine insight into where algorithmic trading was heading.
That thesis is playing out. They're now consistently one of the top builders on Hyperliquid, generating volume and fees that most platforms in this space never reach.
We believe they're still in the earliest innings of what they're building.
If you're on Hyperliquid, you should be using TreadFi.
it happened
@tread_fi is #1 in 24h volume on Hyperliquid builders
leaving behind @phantom, @BasedOneX, @InsilicoTrading, and @Dreamcash
would love to see it holding #1 every time I open the rankings
best way to automate your trading with MM and DN bots, not just on Hyperliquid, but on a huge list of integrated DEXes
Season 1 ends in May
Introducing Timeline, a new way to see the why behind price movements, not just the how.
Timeline overlays the most relevant market-moving headlines directly on your charts, so price action always comes with context.
Below, you’re looking at Trump’s Fed Chair pick odds, with each reprice mapped to the specific headlines that drove it.
This helps you clearly see when narratives shift and how the market responds.
We’re excited to launch a completely new way to see prediction markets.
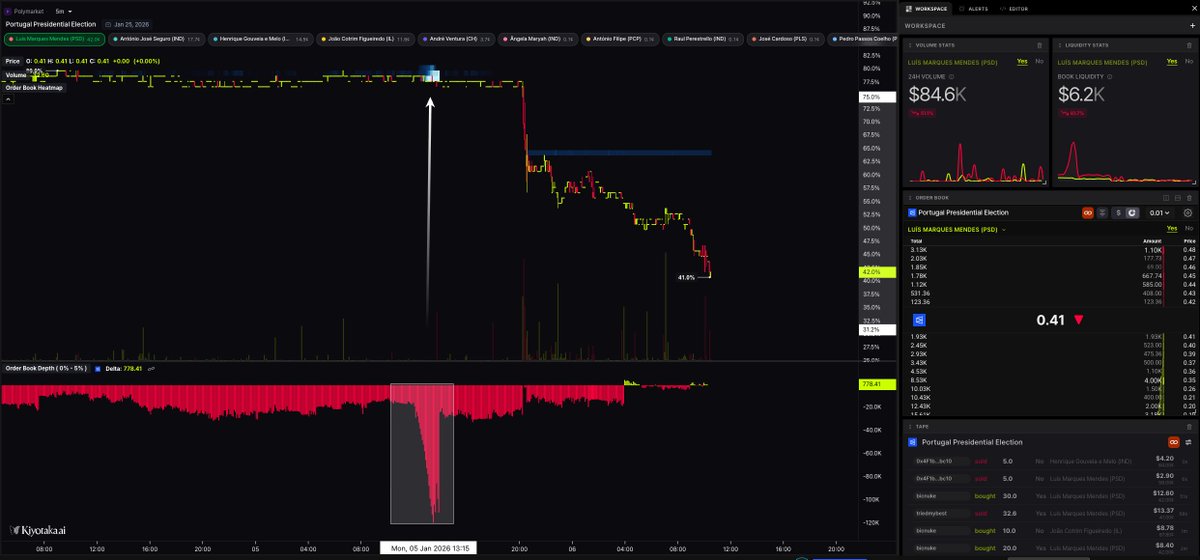
Today we’re rolling out a complete trading stack for prediction markets, from visualization to execution. This unlocks a fundamentally different way to see how money positions before odds move.
Here’s what that looks like in real time: a large sell wall appears in the Portugal Presidential Election market hours before the odds moved down sharply.
> from $1B to $2B traded in 7 days
> peaked #1 @HyperliquidX builder 24H volume
> first token launch community MM effort ($KNTQ @kinetiq_xyz ) today
> 30% of $XYZ100 volume
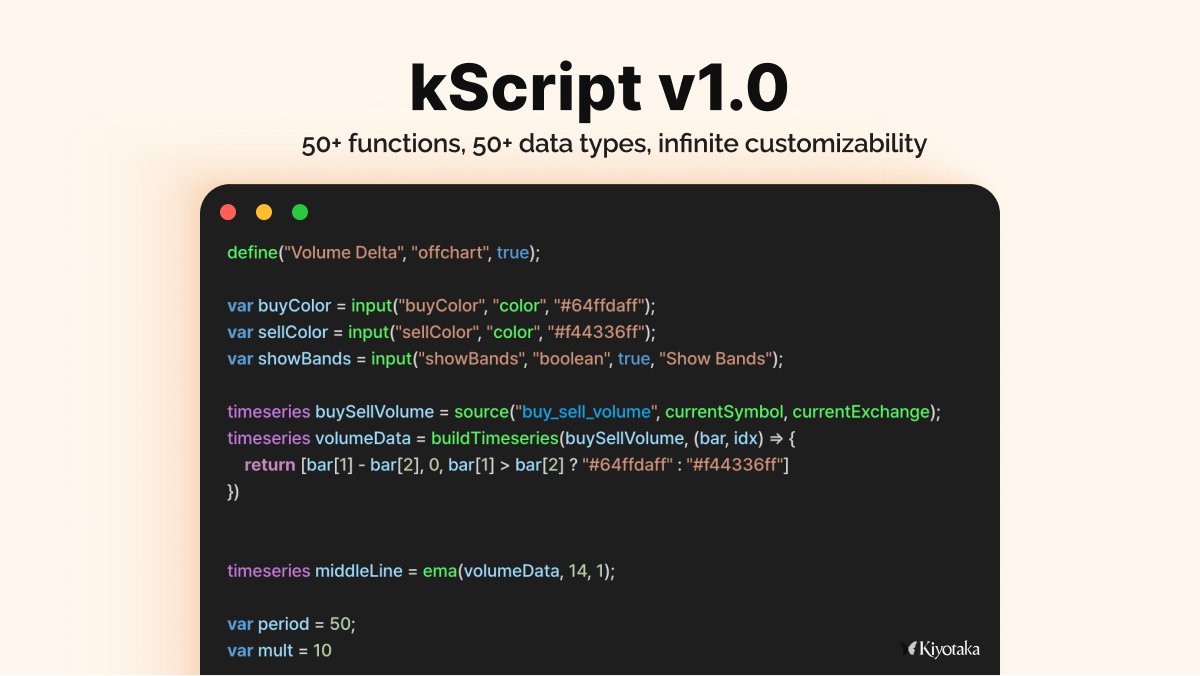
Introducing kScript - our new scripting language built for traders
Faster, richer, and designed for the next generation, kScript lets you tap into our full market data and build custom indicators from day one.
Our team is happy to announce that we have created SYNOPTIC NEWSWIRE, THE SLOWEST MARKET MOVING NEWS.
This is an experimental feed so expect changes along the way.
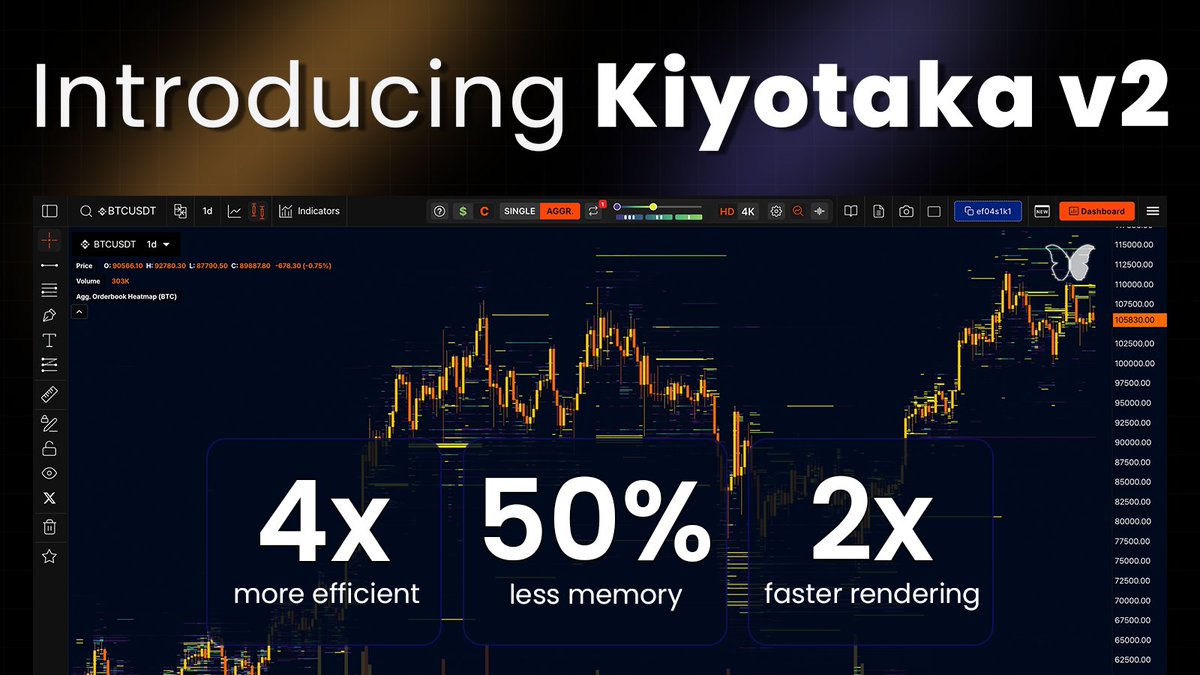
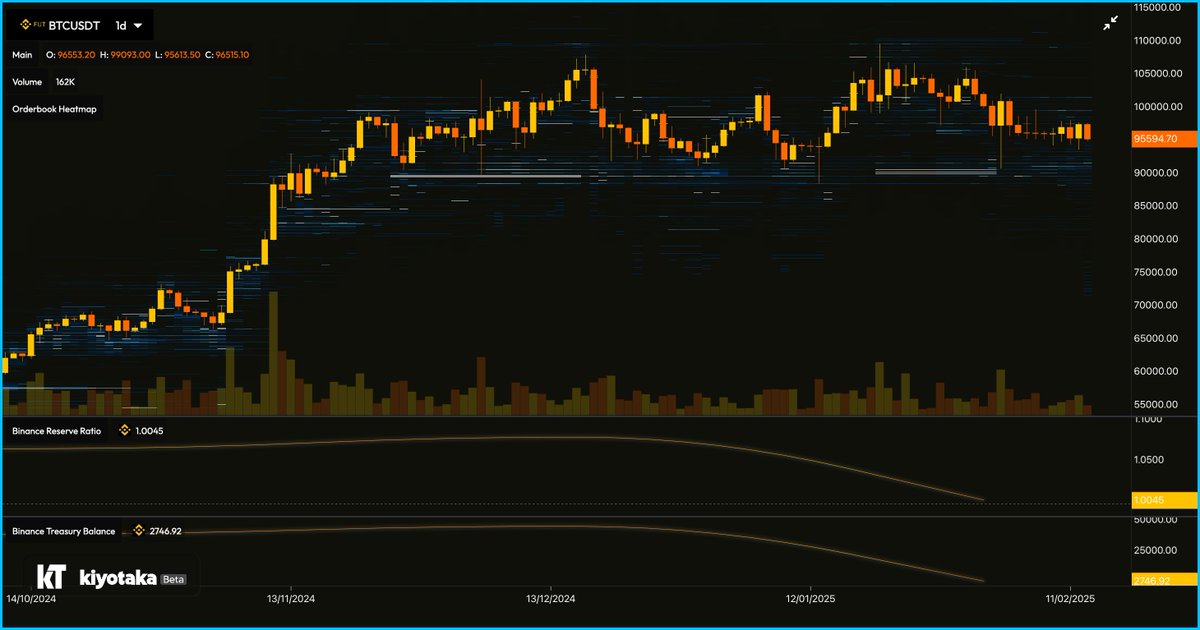
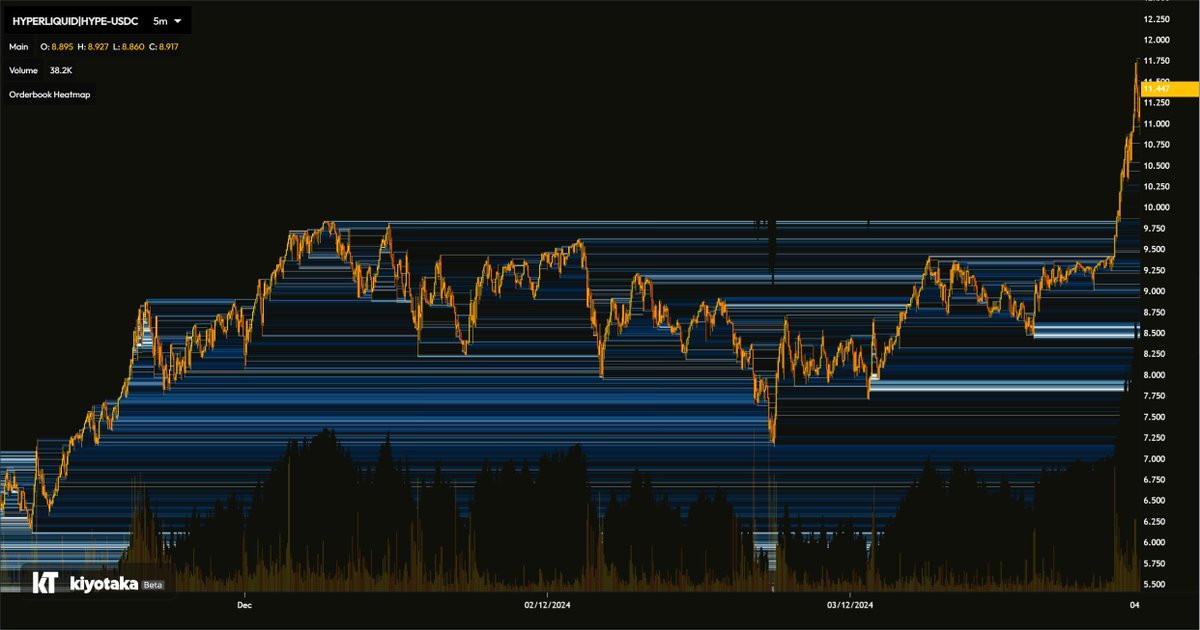
Introducing Kiyotaka v2 — Now THE most lightweight order book charting application
4x more efficient, 60% smaller memory footprint, 2x faster rendering
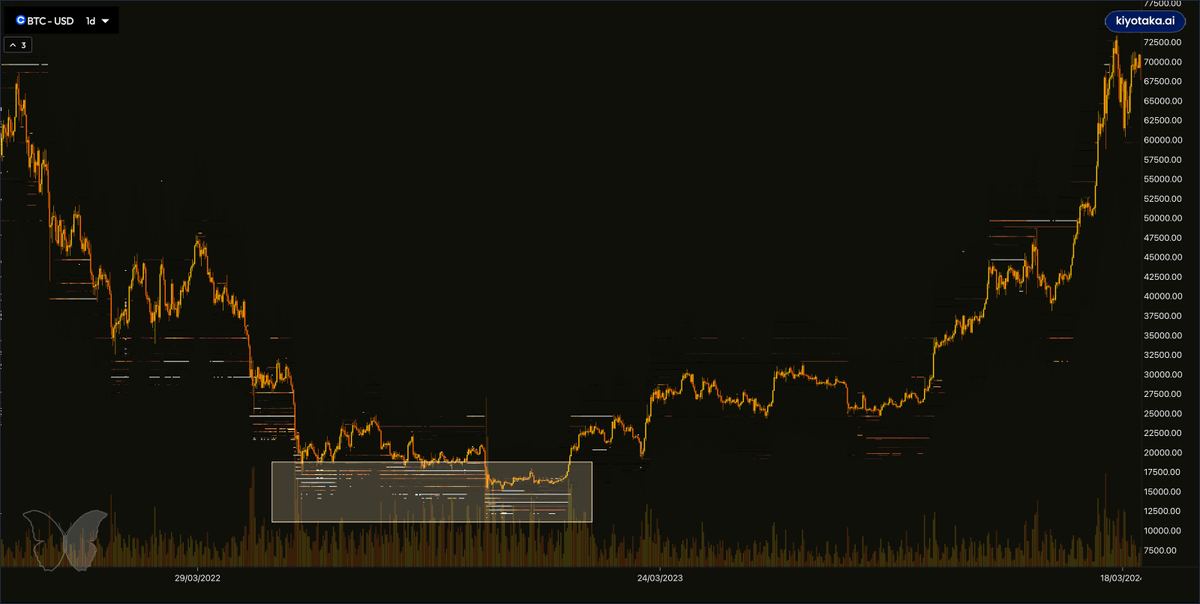
Why did we build order book heatmaps as a trading firm?
In the early days, you only needed to look at funding rate and open interest to trade derivatives relatively well. Back then, Hayes would run your stops for his next Ferrari and you were almost guaranteed to make money by buying the liquidations after the OI buildup was wiped.
These simple indicators clearly signaled when markets were overextended and ready to reverse.
Not anymore.