My go to channels on YouTube for Data Analytics contents:
9. Data With Ezekiel
8. Alex the Analyst
7. Kevin Stratvert
6. Leila Gharani
5. Luke Barouse
4. How to Power BI
3. AnalyzeWithAli
2. Pragmatic Works
1. Learnit Training
Don't forget to repost🔥
If you want to learn Python for data analysis prioritise:
- NumPy (maths)
- Pandas/Polars (data wrangling)
- Matplotlib (Data visualisation)
- Seaborn (built on top of matplotlib, has higher level interface capabilities)
- OS (Operating System Interaction for working with files and folders)
Master the above and you'll be able to defend yourself against any data requests that come your way.
Good luck.
Day 9 & 10: Telling a Business Story Using Statistics 📊🏡
After reflecting and recharging on Day 8, @XteemedAnalyst and I stepped into Day 9 & 10 of the challenge with renewed focus. We imagined ourselves as analysts hired by a U.S.-based property company to uncover insights
groups (e.g., owned vs leased properties).
🎯 Our goal? To explore whether factors like ownership type, location, or historic status significantly impact property value or classification.
We used PowerBi to build a dashboard detailing the key insights and recommendations.
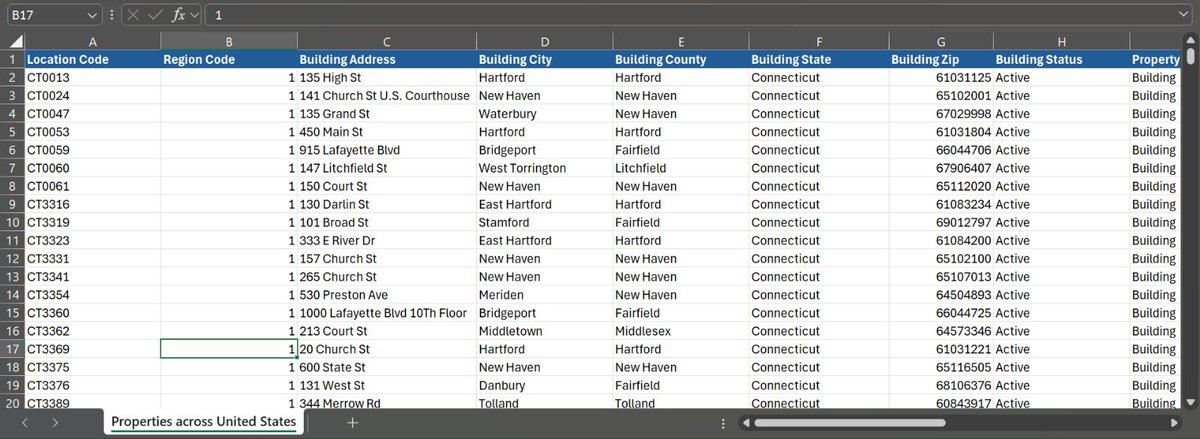
Changed Values to Initial Capital: We used the PROPER function to convert all text to initial capital letters.
Expanded State Abbreviations: We used a find-and-replace method to change abbreviated U.S. state names to their full names.
Removed Unwanted Characters: We utilized the CLEAN function to eliminate any unprintable characters from the data.
Trimmed Irrelevant Spaces: The TRIM function was applied to remove any unnecessary spaces between values.
These steps enhanced the dataset's quality and
DAY 7: “Clean Like a Consultant, LIVE!”
Theme: Deep Data Cleaning + Busting Data Myths.
Myself and @XteemedAnalyst are working on a project via Google meet: Properties across the United States.
We transformed the dataset by applying several data cleaning techniques:
🚀 Day 6 – Exploring Sales with Rossmann Data
My partner and I chose the Rossmann Store Sales dataset because of its rich, real-world business context. The combination of daily sales data, store-level information, and external factors like promotions and holidays immediately
across its stores by understanding the impact of promotions, holidays, and store-specific factors?”
In the real world, retail chains constantly need to balance inventory, staffing, and marketing efforts. With the Rossmann dataset, we want to uncover patterns and insights that
immediately caught our attention.
It felt like the perfect opportunity to explore how real businesses make data-driven decisions in retail — and how external variables influence performance across multiple locations.
🧩 Business Problem We Want to Solve:
“How can Rossmann
Hi everyone!
I’m excited to partner with Blessing Ojo-Adeniyi for this challenge!
She is a detail-oriented Data Analyst with over 2 years of experience in organizing and cleaning datasets, performing statistical analysis and creating impactful reports and resides in Lagos Nigeria
✨ Day 4: Rest & Reflection
Today is a rest day for the challenge — and a perfect time to pause and reflect.
Over just a few days, I’ve already learned so much, gained new insights, and connected with incredible people on the same journey.
This challenge is not just about