Data Analyst | Turning Data into Strategic Insights | Driving Business Decisions with Actionable Intelligence | Excel, SQL, Power BI, Data Visualization
Hi. I'm Oluwaseun. A Data Analyst passionate about transforming raw data into clear, actionable insights. I help businesses make smarter decisions through storytelling, visualization & strategy. Skilled in Excel, SQL & Power BI. Here to share, learn, and connect.
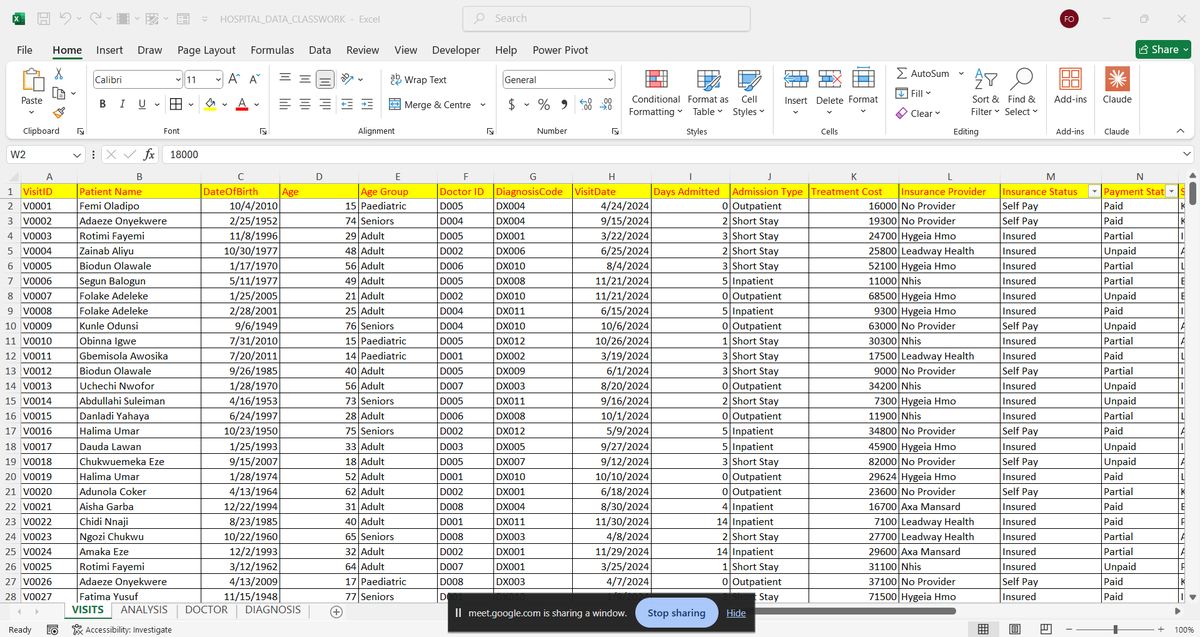
Excel101 week 3 concluded.
Week 4 commences on Saturday.
It's still not too late to get involved. Recordings to previous classes are available.
Send a dm today.
Week 3 of EXCEL101 was where students began thinking less like spreadsheet users and more like analysts.
Before touching PivotTables, we focused on something more important: asking the right questions.
Because analysis doesn't start with charts or reports. It starts with understanding what problem you're trying to solve and what answer you're looking for.
From there, we explored PivotTables in depth.
@Lima_D_Analyst kicked off the class on Saturday
Students learned how to:
* Build PivotTables from scratch
* Use Rows, Columns, Values, and Filters effectively
* Group dates by Month, Quarter, and Year
* Calculate Running Totals and Percentage of Total
* Create Calculated Fields
* Manage multiple PivotTables from a single data source
The goal wasn't just summarizing data. It was learning how to turn large datasets into meaningful insights.
We then moved into PivotCharts and dashboard design.
We discussed how different visuals answer different questions and why effective dashboards focus on clarity rather than complexity.
Topics covered included:
* Bar, Line, Donut, and Clustered Bar Charts
* KPI Cards
* Visual Hierarchy
* Dashboard Layout
* Report Storytelling
One of the highlights of the week was introducing Slicers and Timelines.
Students learned how to connect a single filter to multiple PivotTables, allowing entire dashboards to update instantly with a few clicks.
That was the moment many began to see Excel as more than a spreadsheet tool. It became a reporting system.
This week's assignment, designed and reviewed by @TheBoyAnalyst, involved a Retail Sales Data Workshop containing:
* 1,200 sales records
* 10 stores
* 12 products
* Multiple worksheets
Students were required to:
* Clean the dataset
* Enrich missing information using XLOOKUP
* Create performance metrics with IF and IFS
* Build a dashboard powered by five PivotTables
The final dashboard had to answer key business questions around:
* Store revenue performance
* Monthly sales trends
* Product category performance
* Payment method distribution
* Regional channel performance
The submissions demonstrated strong growth. The dashboards were structured, interactive, and focused on answering business questions rather than simply displaying numbers.
The final deliverable for Week 3 was a fully interactive dashboard capable of exploring data through slicers, visualizations, and dynamic reporting.
Next up: Power Query, ETL, and Descriptive Statistics.
Week 2 of EXCEL101 is done… and this was the week the class started thinking differently about data.
Week 1 gave us the foundation.
Week 2 introduced something more important:
The idea that analysts don’t “fix data manually.”
They build systems that clean, structure, and automate the work for them.
That mindset shift changed the atmosphere in the room almost immediately.
We opened with one principle:
"GIGO — Garbage In, Garbage Out."
It didn’t matter how beautiful a dashboard looked or how advanced a formula was.
If the underlying data was dirty, inconsistent, or poorly structured, the analysis would always be unreliable.
And honestly, that realization hit a lot of people hard 😂
Because most spreadsheet frustration doesn’t come from Excel “misbehaving.”
It comes from bad data.
So this week became all about control.
We explored text cleaning functions:
TRIM, CLEAN, SUBSTITUTE, PROPER, UPPER, LOWER, LEFT, RIGHT, MID, LEN, CONCAT, TEXTJOIN…
…and for the first time, students started seeing Excel less as a calculator and more as a transformation tool.
One of my favourite moments was introducing function nesting.
Watching:
=PROPER(TRIM(CLEAN(A2)))
go from “confusing formula” to “wait… this is actually genius” was satisfying to watch.
Because that’s when people begin understanding that formulas are not isolated tools.
They can work together.
And once you understand that, Excel becomes significantly more powerful.
We also spent time on:
📌 Aggregate Functions — SUM, AVERAGE, MIN, MAX, COUNT, COUNTA
📌 Conditional Aggregates — SUMIFS, COUNTIFS, AVERAGEIF
📌 Ranking Functions — LARGE, SMALL, RANK
📌 Logical Functions — IF, Nested IF, AND, OR, IFS
📌 Lookup Functions — VLOOKUP, XLOOKUP, INDEX+MATCH
The Lookup session especially changed the energy in the room.
Because once people realize they no longer need to manually search through tables or repeatedly type the same information…
…there’s no going back.
Then came the assignment.
This week’s challenge came from @TheBoyAnalyst
A Banking Loan Data Cleaning & Analysis task involving 300 rows of dirty loan data spread across 3 tables:
LOANS, OFFICER, and PRODUCT.
Students had to:
✔ Clean the LOANS dataset
✔ Standardize the structure
✔ Use XLOOKUP to retrieve officer and product details
✔ Automate calculations instead of manually typing values
And this part mattered most:
An analyst never types what already exists in a table.
That sentence alone summarizes half of data analysis.
Corrections have already been reviewed and returned — and honestly, the quality of submissions this week showed growth.
The deliverable at the end of Week 2:
A fully cleaned dataset and automated calculation sheets with minimal manual intervention.
That’s real progress.
Next up:
📊 PivotTables
📈 Dashboards
📉 Descriptive Statistics
Week 3 is where the datasets start talking back.