Today's Chart of the Day was shared by @HostileCharts
Breadth has broadened, but with 20 stocks controlling half the index, the market still needs its heavyweights to participate.
Get the full details in today's report plus more great charts. ⬇️
https://t.co/bgOtwMEYlS
At one point this year, nobody wanted to own Microsoft, or software as a whole.
Now, $MSFT looks like the cleanest setup in the Magnificent Seven.
Read the full note in today's Morning Print. 🌤️
https://t.co/Qy3cJ9YfOg
Today's Chart of the Day was shared by @Convertbond
Apple hit record highs today and reclaimed its title as the world’s most valuable company, while Nvidia continues to slide amid a wave of new headlines.
Get the full details in today's report plus more great charts. ⬇️
https://t.co/6s0ryYmu9R
After four years of frustrating price action, healthcare providers look like the next area within the sector ready to get going.
Read the full note in today's Morning Print. 🌤️
https://t.co/5DrxTPxUy4
Today's Chart of the Day was shared by @Beyond_Charting
The U.S. Dollar Index just logged its biggest two-day gain in five months and is now trading at new 52-week highs.
If history rhymes with Trump’s first term, this move could have legs well into 2027.
Get the full details in today's report plus more great charts. ⬇️
https://t.co/8AyvSjKLZm
Today's Chart of the Day was shared by @EquityClock
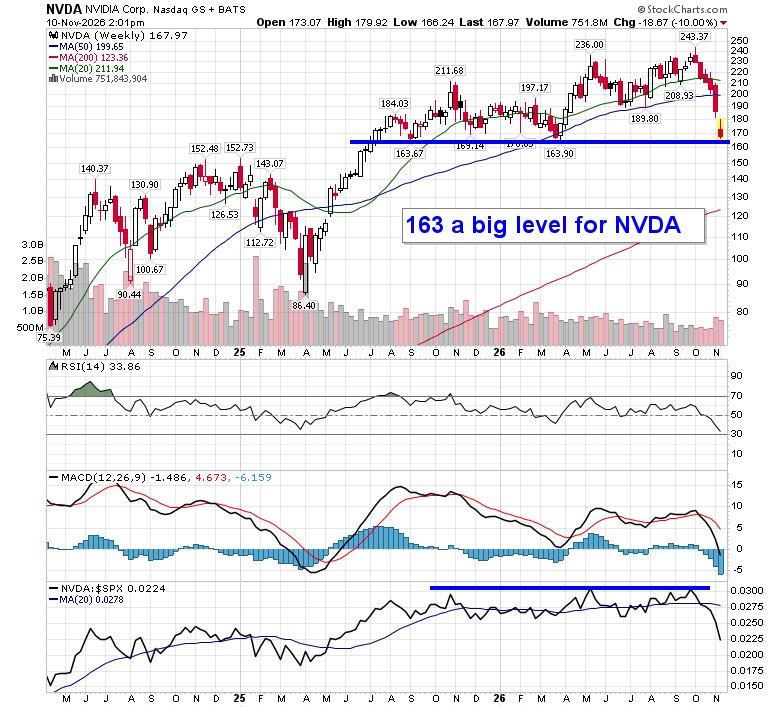
Nvidia is testing a major support level after a historic losing streak, and its next move will likely set the tone for the entire tech sector.
Get the full details in today's report plus more great charts. ⬇️
https://t.co/tAM7qTP3gx
While the market has struggled over the past month, insurance stocks have charged higher.
The iShares U.S. Insurance ETF is attempting to put the finishing touches on a cup-and-handle breakout and is on track to close the week at new all-time highs.
Read the full note in today's Morning Print. 🌤️
https://t.co/OkziwjyEDW
Today's Chart of the Day was shared by @EquityClock
Nvidia is testing a major support level after a historic losing streak, and its next move will likely set the tone for the entire tech sector.
Get the full details in today's report plus more great charts. ⬇️
https://t.co/tAM7qTP3gx
The best days often follow the worst ones.
The NYSE Composite Index just posted its best breadth day of the year, coming right on the heels of its worst day of the year last Thursday.
Read the full note in today's Morning Print. 🌤️
https://t.co/7DcwGrfJO1
Today's Chart of the Day was shared by @JC_ParetsX
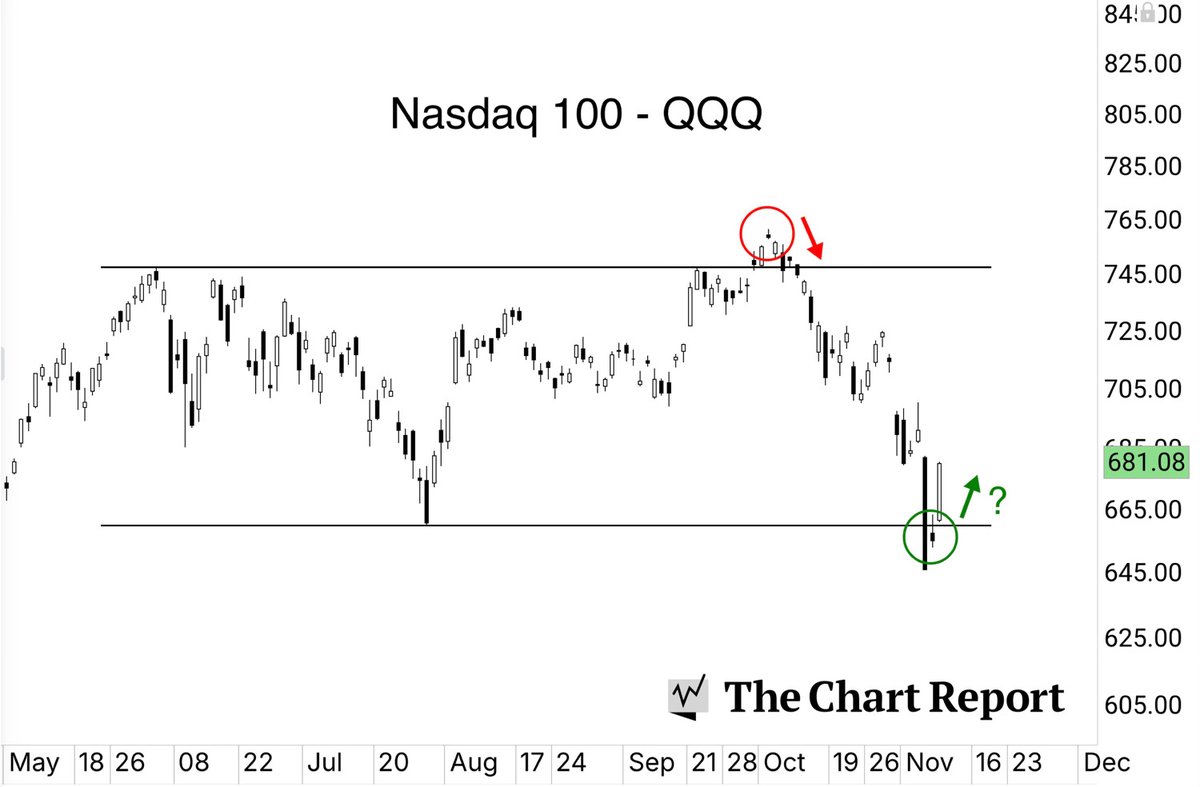
The Nasdaq is reclaiming a key support level after a brief break below it, and if the failed breakdown holds, the snapback could be just as sharp as the selloff.
Get the full details in today's report plus more great charts. ⬇️
https://t.co/gbarfp8LPv
Last week, the equal-weight Nasdaq 100 $QQQE broke down from a multi-month head & shoulders top on its worst day since the April 2025 tariff selloff.
Read the full note in today's Morning Print. 🌤️
https://t.co/JjZxMhN0F8
Today's Chart of the Day was shared by @sstrazza
Semiconductors relative to the S&P 500 have broken down from a multi-month top as their 5-week rate of change plunged to -26.5%, a sequence eerily similar to what we saw in 2000 when the dot-com bubble burst.
Get the full details in today's report plus more great charts. ⬇️
https://t.co/YHfOMDnKD0