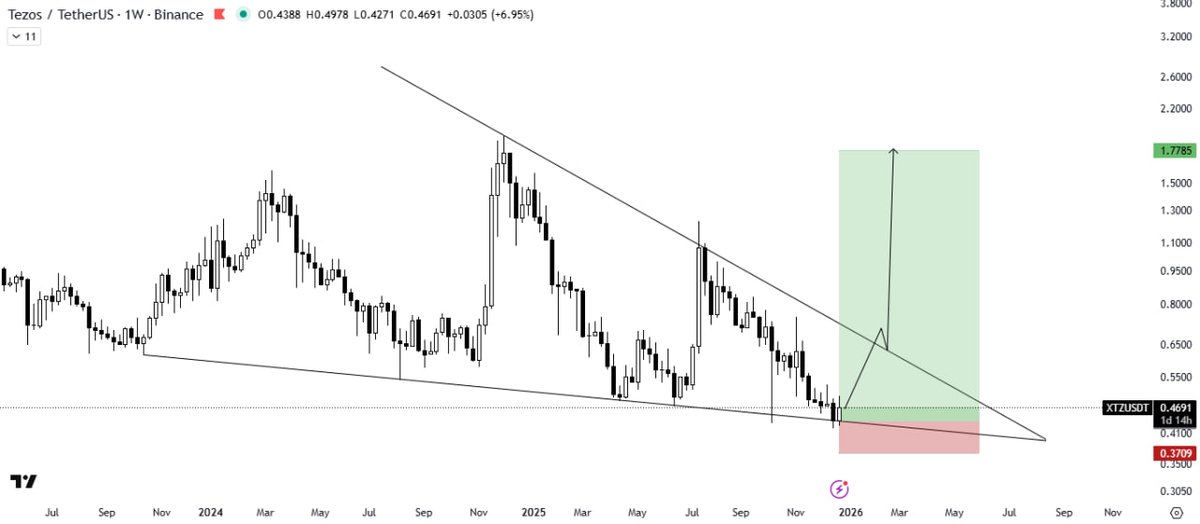
#XTZ/USDT BUY SETUP
XTZ is consolidating within a falling wedge and rebounding from the lower support trendline with strong momentum. A decisive breakout above the wedge resistance would confirm a strong bullish rally. 🚀
#BTC/USDT ANALYSIS
Bitcoin is rebounding from the horizontal demand zone of the descending triangle and trading below the resistance trendline, with the Ichimoku Cloud acting as resistance. A confirmed breakout or breakdown is needed to determine the next directional move.
#BTC/USDT ANALYSIS
Bitcoin has broken down from the symmetrical triangle and is trading above a key horizontal demand zone, with the Ichimoku Cloud acting as resistance. A rebound from the demand zone is possible.
🚨 BREAKING: JAPAN TO START SELLING $500B+ IN ETFs
Japan’s central bank plans to begin selling its ¥83 trillion ($534B) ETF holdings as soon as next month.
The BOJ will sell slowly at about ¥330B per year to avoid market shocks, a process expected to stretch over 100 years.
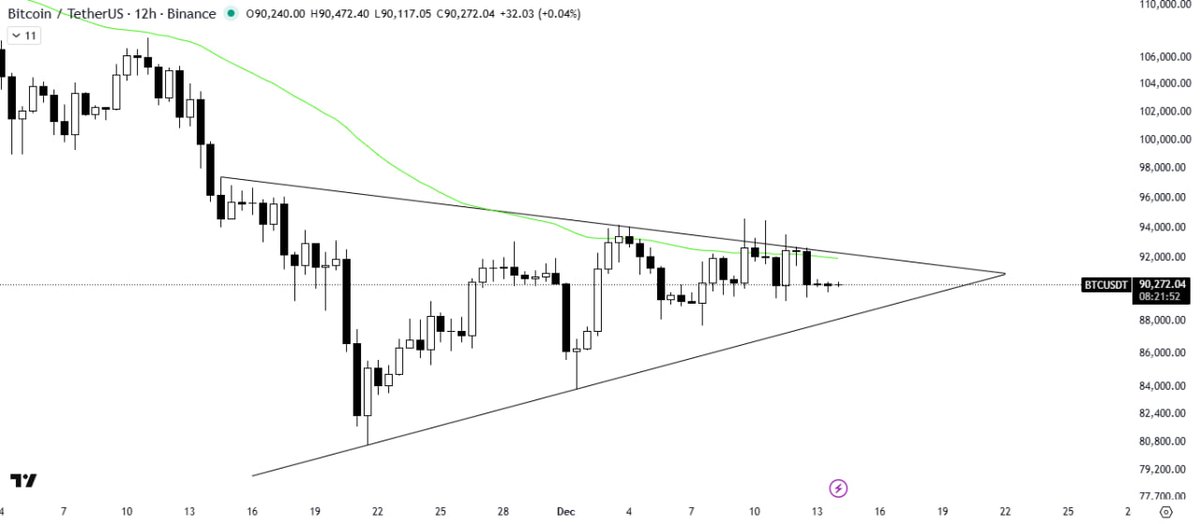
#BTC/USDT ANALYSIS
Bitcoin is rebounding from the support trendline of the symmetrical triangle, with the 50MA acting as resistance above price. A solid breakout of the pattern would signal a bullish trend, keep an eye on further price action.
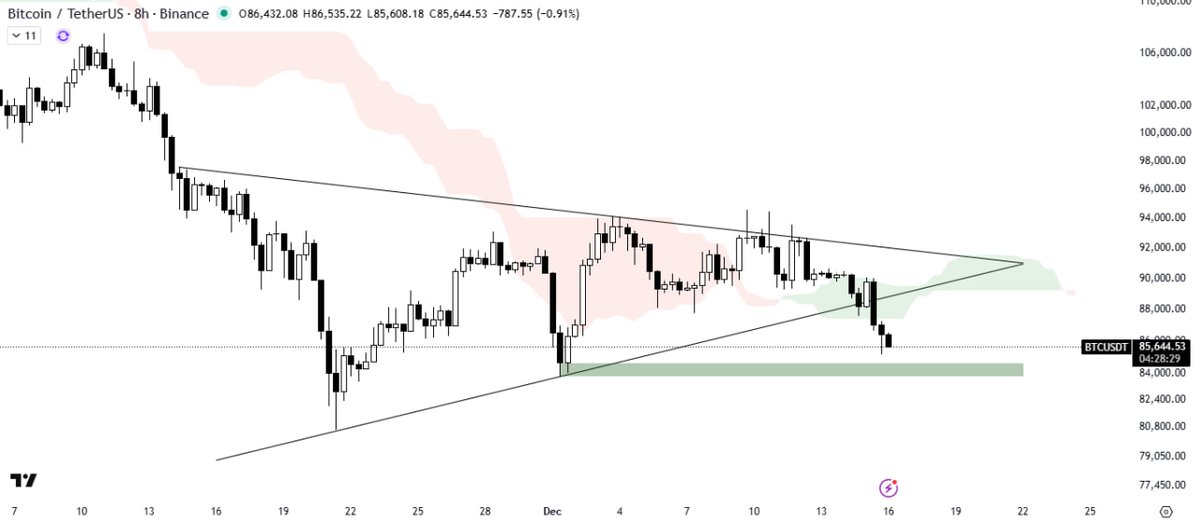
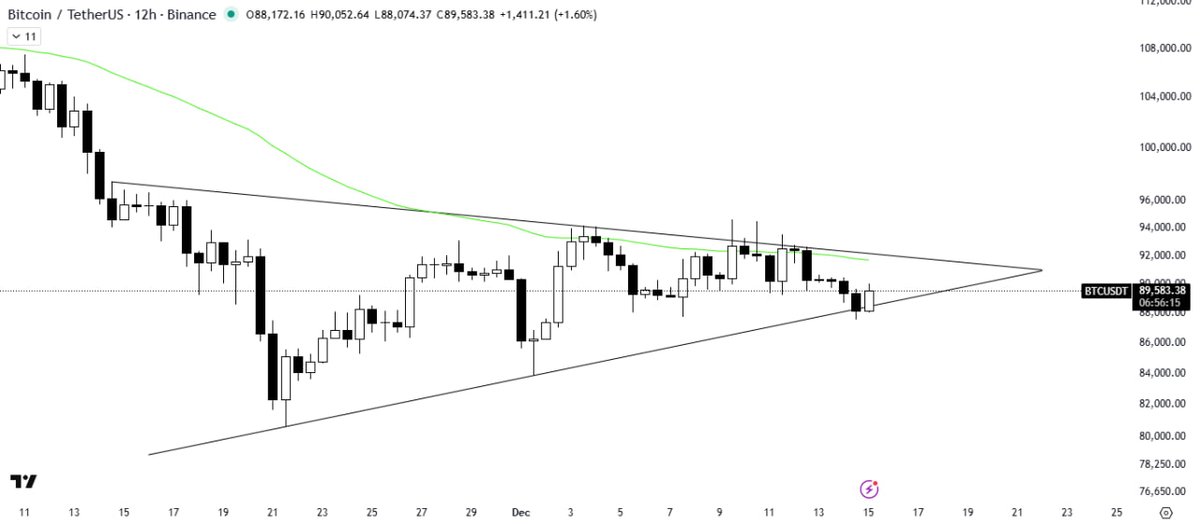
#BTC/USDT ANALYSIS
Bitcoin is consolidating within a symmetrical triangle and facing rejection from the resistance trendline, with the 50MA acting as overhead resistance. A solid breakout or breakdown is needed to confirm the next directional move.
#LPT/USDT BUY SETUP
LPT is consolidating inside the descending triangle pattern and is currently trading within the horizontal demand zone. A bounce from this level is likely, and a breakout above the pattern will provide a strong bullish confirmation.
#BTC/USDT ANALYSIS
Bitcoin is rebounding from the support trendline of the ascending triangle pattern. The Ichimoku Cloud is acting as support, showing underlying strength. We now need to wait for a clear breakout or breakdown to confirm the next directional move.
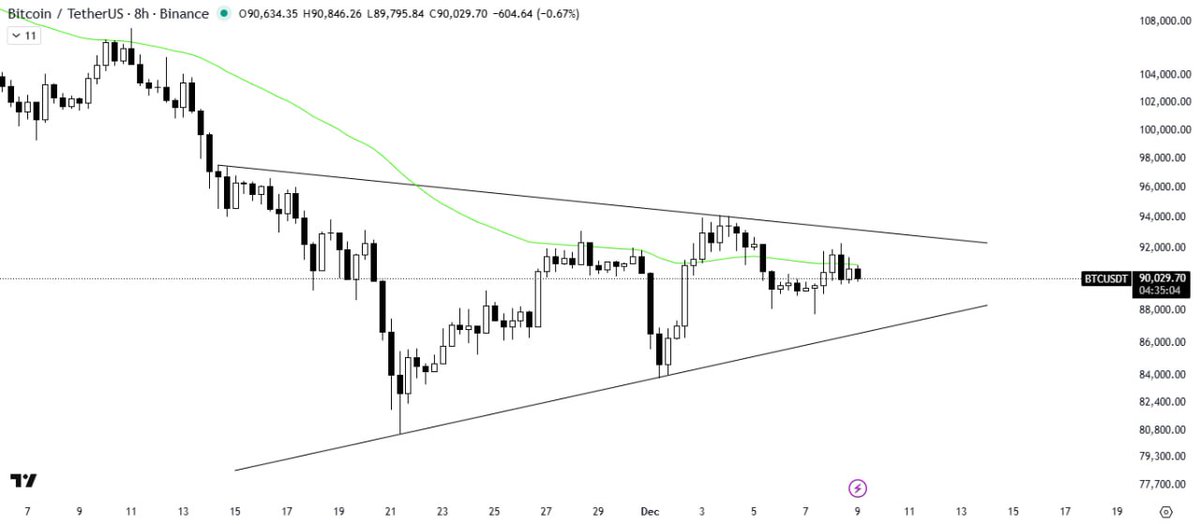
#BTC/USDT ANALYSIS
Bitcoin is consolidating inside a symmetrical triangle and trading below the 50MA, which is acting as resistance. A rebound from support or a breakout above the 50MA and the pattern will confirm the next bullish move.
BREAKING: U.S. LABOR DEPT TO RELEASE OCT & NOV PPI IN JAN 2026
Labor Department confirms both months’ PPI will be published together next month, despite earlier claims it wouldn’t be published.