The idea that security spend should feed into yield pricing makes a lot of sense. LPs are already exposed to this risk, they just can't see it. If DSPR becomes a standard, it would fit cleanly into the kind of protocol-level analysis we surface on Sphere.
DeFi has lost between $730M and $3.1B to exploits every single year since 2021.
TVL has swung from $175B peak to $45B trough and back above $100B.
The loss rate as a % of TVL is 1–3% / year depending on the cycle.
I've been thinking about a simple metric to price this risk: the DeFi Security Premium Ratio (DSRP).
DSPR = Security Spend / TVL.
Reported quarterly. Both sides verifiable on-chain.
Five tiers: Hardened (>1%) / Protected (0.5–1%) / Baseline (0.2–0.5%) / Underspending (0.05–0.2%) / Exposed (<0.05%)
DSPR acts as a yield pricing input.
Low DSPR = higher required yield to compensate LP for security risk.
High DSPR = protocol earns a lower cost of capital.
We need a ratings mechanism on chain to price yield
Any protocol that is underspending in security needs to be called out and either spend more, divert more fees to an insurance fund, or both
@Blockworks you should add it to the token transparency portal. but now do one for protocol health
L1s should also carve out % of validator rewards or fees to DeFi protocols taking security seriously
Need to think more about how to verify and create manipulation-resistant security spend receipts @_SEAL_Org - any ideas?
For anyone tracking how RWA collateral is reshaping lending rates, Sphere breaks down every market by collateral type, concentration risk, and historical rate behavior.
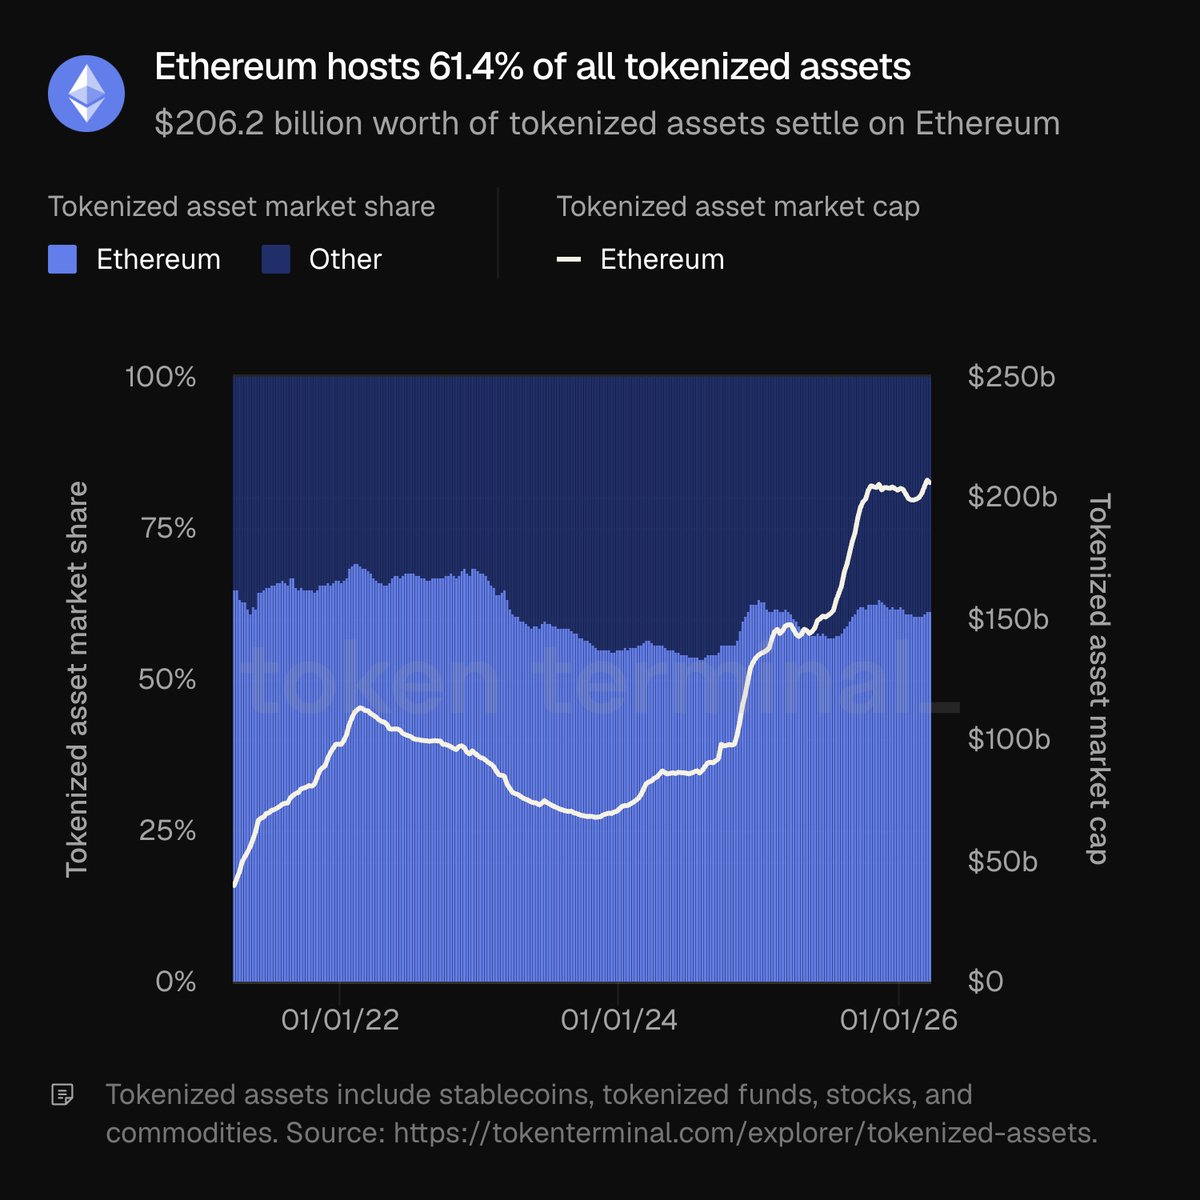
Ethereum settles $206B+ in tokenized assets. That's 61.4% of the global total, up over 40% year over year.
BlackRock's BUIDL alone grew 36% in the past month.
Stablecoins, tokenized funds, equities, and commodities are all growing onchain.
What does this mean for DeFi lending?
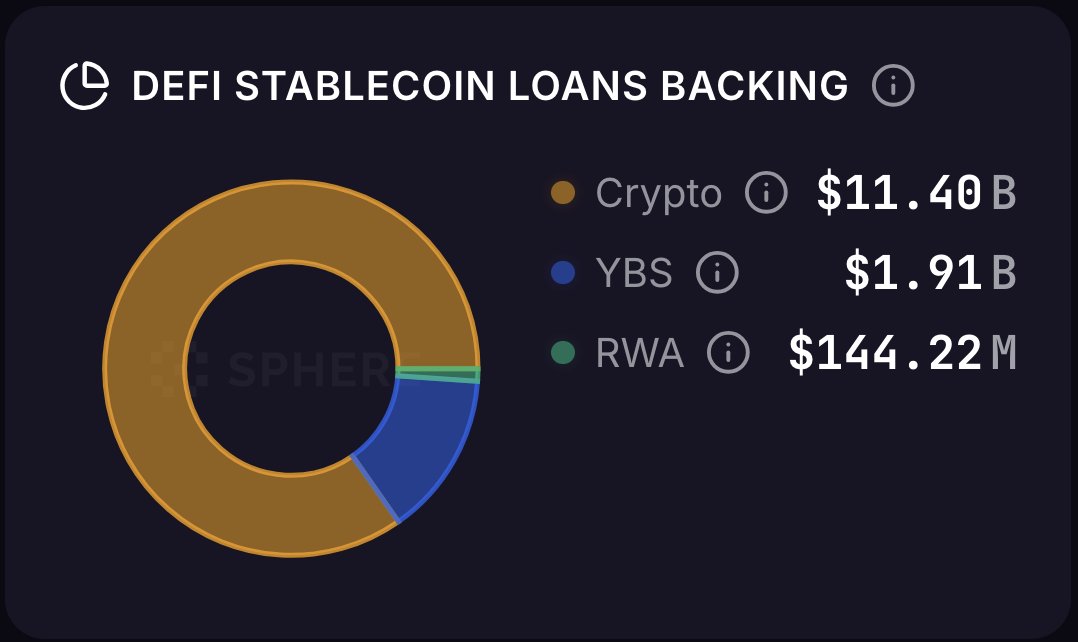
RWA-backed loans are still a small slice of the market, but the composition is shifting.
As more traditional assets get tokenized and used as collateral, lending markets are seeing new borrowing demand and risk profiles that look nothing like the usual WETH/wstETH markets.
We track this breakdown on Sphere's Overview page: Crypto vs YBS vs RWA collateral.
Funding at 1.30%. Stablecoin borrowing stuck at 3.44%. Supply yields dragging at 2.24%.
No leverage appetite, no rate recovery.
We're at @EthCC this week. Come talk rates.
Weekly Yield Thread 3/31
1/ Macro Overhang Keeps Yields Pinned
With geopolitical conflicts showing no immediate signs of alleviation, crypto majors remain under pressure, and organic demand for leverage is struggling to mount a real recovery.
The onchain reality clearly reflects thr macro hesitancy:
Funding Stays Flat: Funding rates are still struggling to climb, with the 1-week average funding benchmark currently sitting at a mere 1.30%.
Borrowing Costs Pinned: Onchain stablecoin borrowing costs remain trapped in the 3.5% to 4% range, clocking a 1-week average of 3.44%.
Tracking the Baselines: These sluggish borrowing costs are closely tracking the major foundational yields across DeFi, heavily anchored by the Sky Saving Rate at 3.75% and Ethena's sUSDe APY at 3.5%.
Supply Yields: Consequently, the 1-week average stablecoin supply APY is hovering down at just 2.24%.
We're heading to @EthCC Cannes next week.
Want to talk stablecoin lending analytics, risk infrastructure, or what we're building at Sphere? DM anyone from @BlockAnalitica.
Let's meet.
Want to save up to 45% on your leverage position?
Liquity V2 saves you up to $5'000 on $100k ETH per year.
Because it has the best rates in DeFi - see @BlockAnalitica 👇
Let's break down the numbers. 🧵
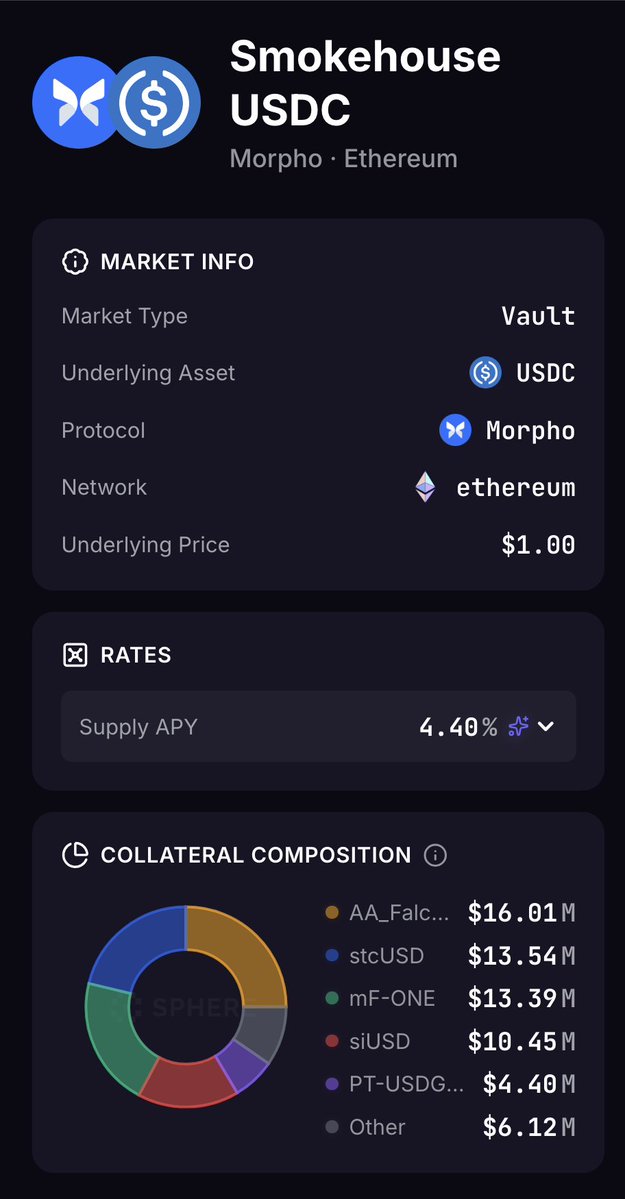
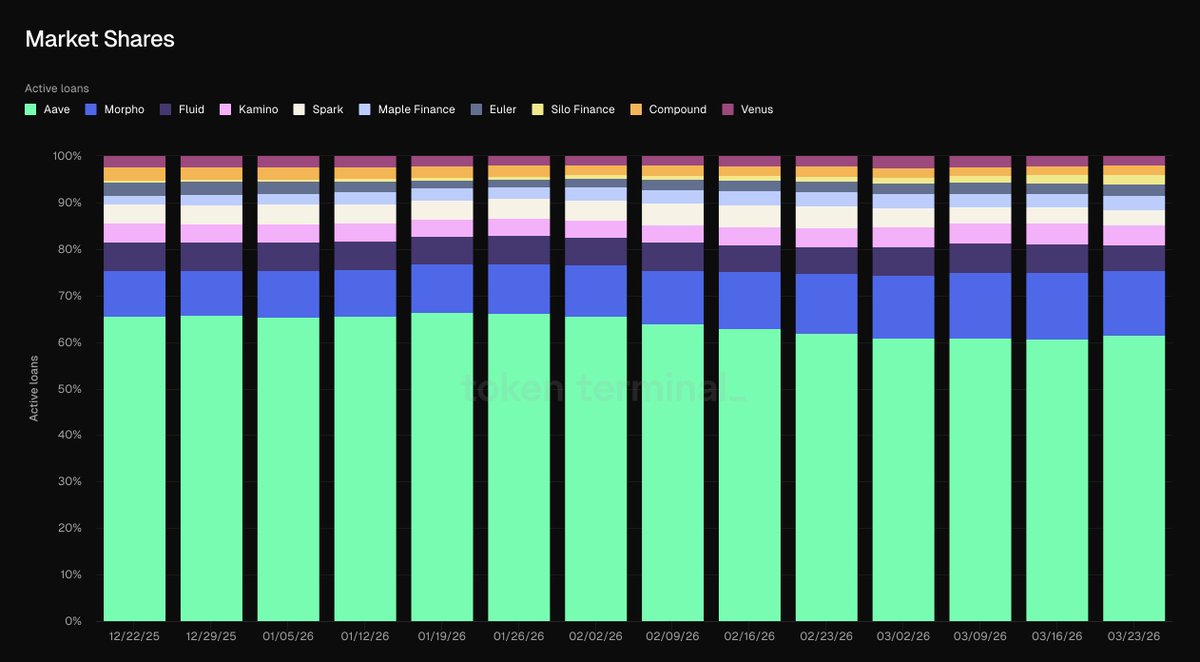
Stablecoin lending on Morpho keeps growing. Active loan market share just hit a new ATH.
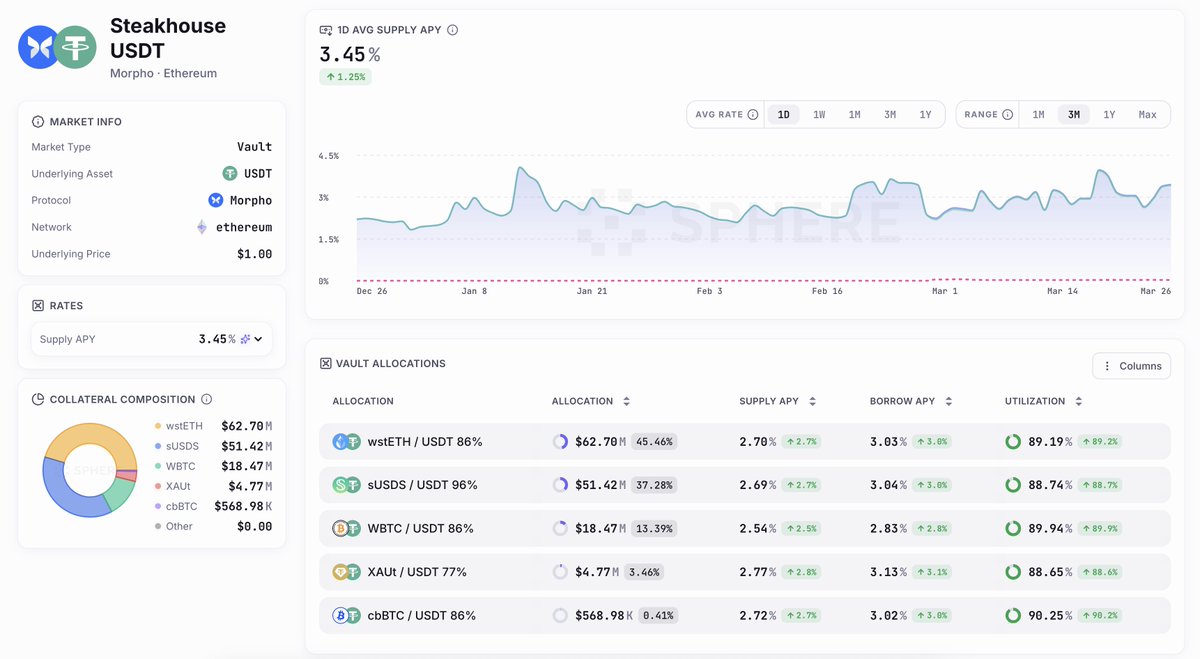
Sphere lets you look under the hood of almost every Morpho stablecoin vault. What's allocated where, and what collateral backs it.
We use @SkyEcosystem SSR as the DeFi benchmark rate on Sphere for exactly the reasons @vadymnx lays out here.
At 3.75%, it sits above SOFR and 3m T-Bills on our dashboard.
Coming next: more protocols, more networks, and the Sphere API for programmatic access to everything in the database.
For a more detailed breakdown, read the substack.
https://t.co/RfzHffUMYI
Sandbox Mode: 4,000+ data series across global, protocol, deployment, and market tiers. Mix up to 10 series per chart. Build your own dashboards.
All stored locally, no account required.
Your data. Your lens.