📢 New Report: How to expand into Africa
Africa is a market of over 1.5 billion people, with accelerating digital adoption.
In partnership with @ItanaAfrica, we've put together a practical guide for expansion in Africa.
Get the guide now https://t.co/avttGuRN6v
Portfolio investment into Nigeria reached $9.86 billion in Q1 2026, the highest level recorded across 51 quarters of data.
The figure was higher than the previous major peak of $7.11 billion recorded in Q1 2019 and almost double the $5.20 billion recorded in Q1 2025.
Portfolio investment accounted for 95% of Nigeria’s total capital importation in Q1 2026, showing that the latest surge was driven mainly by financial-market inflows.
Foreign Direct Investment remained much smaller at $135 million, while Other Investment stood at $374 million, covering inflows such as trade credits, loans, currency deposits, and other claims.
Three years on from fuel subsidy removal, this is what happened to food in Nigeria.
Of the staples we could compare directly, not one got cheaper. Every item is at least double its May 2023 price — the last full month before the policy hit. Nearly half have tripled. Plantain has climbed almost six-fold; yam nearly five. And the items that held up best — gari, beans, maize — still doubled.
For households, feeding a family now costs at least twice what it did.
Portfolio investment into Nigeria reached $9.86 billion in Q1 2026, the highest level recorded across 51 quarters of data.
The figure was higher than the previous major peak of $7.11 billion recorded in Q1 2019 and almost double the $5.20 billion recorded in Q1 2025.
Portfolio investment accounted for 95% of Nigeria’s total capital importation in Q1 2026, showing that the latest surge was driven mainly by financial-market inflows.
Foreign Direct Investment remained much smaller at $135 million, while Other Investment stood at $374 million, covering inflows such as trade credits, loans, currency deposits, and other claims.
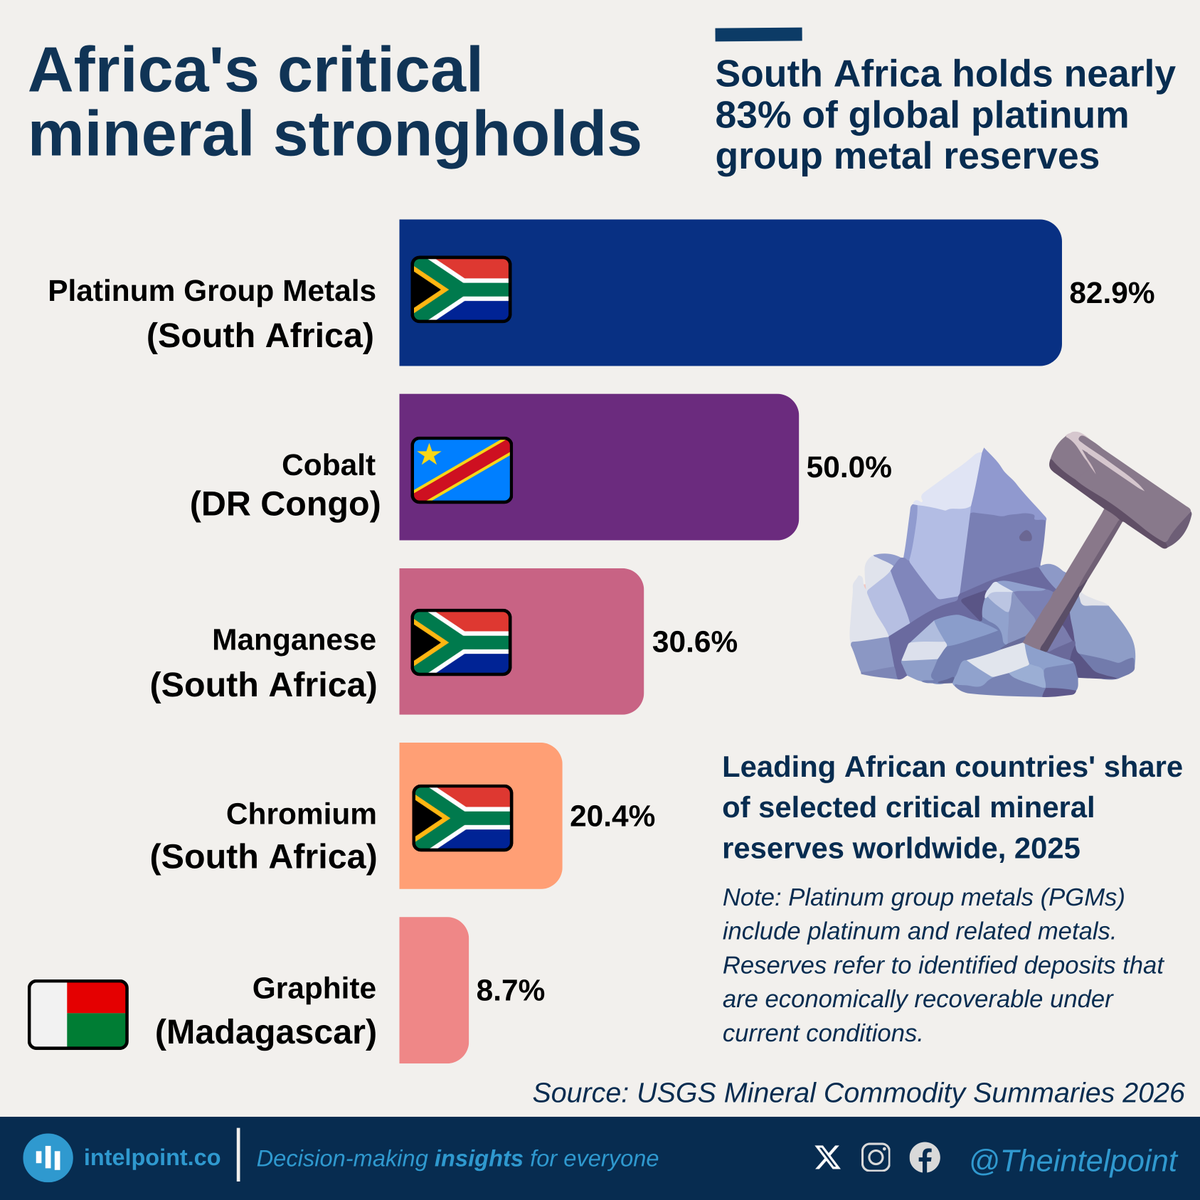
Major economies are trying to secure critical mineral supply chains outside China, and Africa is central to that race.
South Africa alone holds nearly 83% of global platinum group metal reserves and over 30% of manganese reserves, while the DRC accounts for half of global cobalt reserves. Madagascar also holds almost 9% of global graphite reserves.
This is why South Africa is pushing for more beneficiation, processing, and industrial development as the EU launches a €12bn investment push in the country. The DRC has also moved to control cobalt exports through quotas, showing how mineral-rich countries are trying to gain more influence over value, pricing, and supply.
Three years on from fuel subsidy removal, this is what happened to food in Nigeria.
Of the staples we could compare directly, not one got cheaper. Every item is at least double its May 2023 price — the last full month before the policy hit. Nearly half have tripled. Plantain has climbed almost six-fold; yam nearly five. And the items that held up best — gari, beans, maize — still doubled.
For households, feeding a family now costs at least twice what it did.
At the national average, one adult’s monthly healthy diet would take about two-thirds of Nigeria’s ₦70,000 minimum wage.
In March 2026, the average cost of a healthy diet was ₦1,541 per adult per day. Over 30 days, that comes to ₦46,230, or 66% of the minimum wage before rent, transport, utilities, healthcare, and other household expenses.
The burden was highest in Ekiti, where one adult’s monthly healthy diet would take 90% of the minimum wage. Imo followed at 88%, while Abia, Lagos, Ebonyi, and Bayelsa were all above 80%.
Adamawa had the lowest burden at 43%, followed by the FCT at 48% and Taraba at 49%.
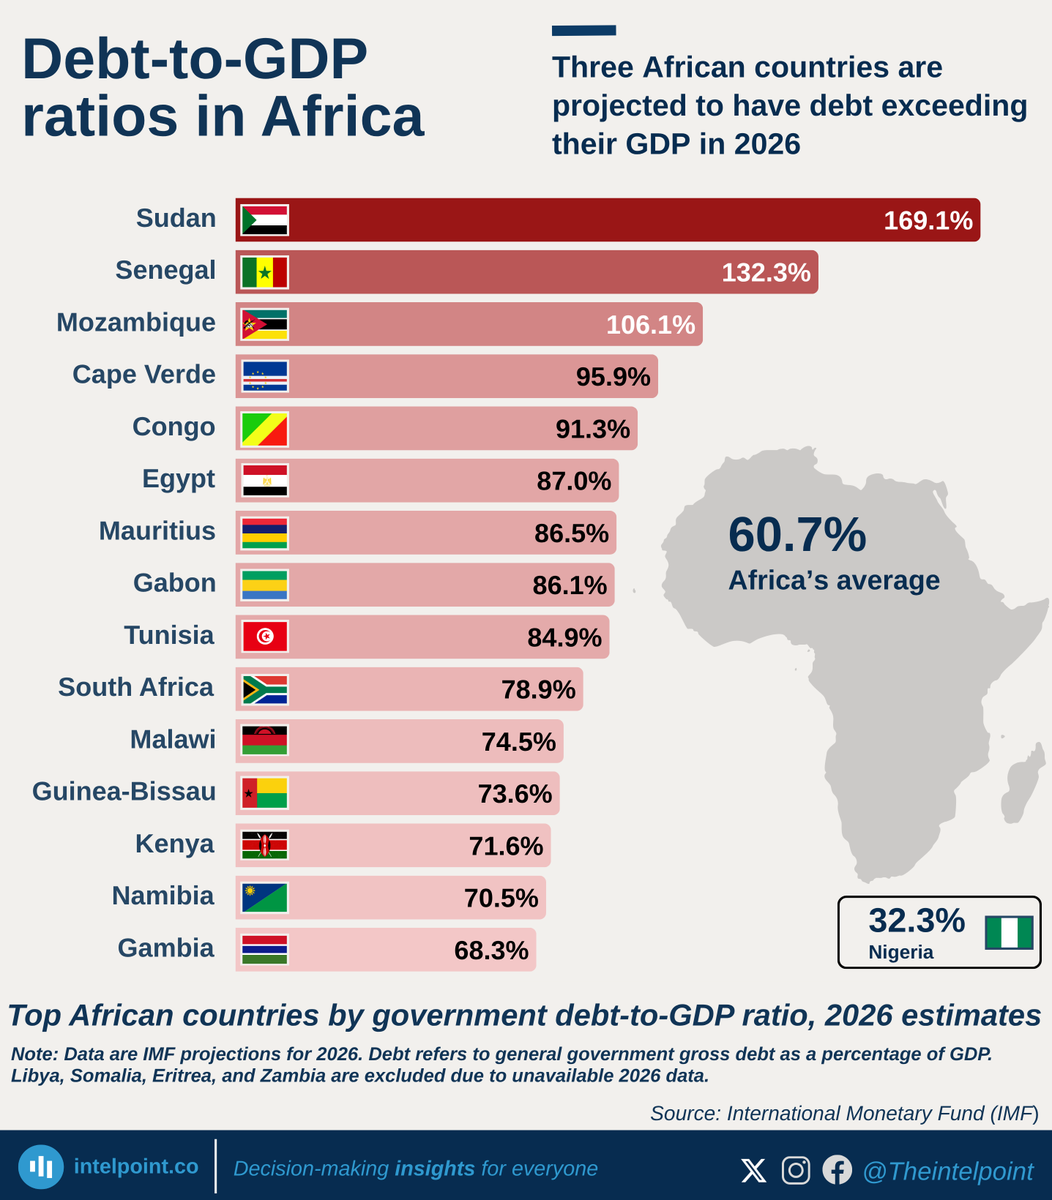
Sudan's projected debt burden in 2026 is equivalent to 169.1% of its GDP.
It is one of three African countries expected to have debt exceeding the size of their economies, alongside Senegal and Mozambique.
Africa's average debt-to-GDP ratio is projected at 60.7%, while Nigeria's stands at 32.3%.
@Bnearway In one month, one adult’s average healthy diet would take 66% of Nigeria’s ₦70,000 minimum wage, rising to as high as 90% in Ekiti.
https://t.co/acADYq86yI
At the national average, one adult’s monthly healthy diet would take about two-thirds of Nigeria’s ₦70,000 minimum wage.
In March 2026, the average cost of a healthy diet was ₦1,541 per adult per day. Over 30 days, that comes to ₦46,230, or 66% of the minimum wage before rent, transport, utilities, healthcare, and other household expenses.
The burden was highest in Ekiti, where one adult’s monthly healthy diet would take 90% of the minimum wage. Imo followed at 88%, while Abia, Lagos, Ebonyi, and Bayelsa were all above 80%.
Adamawa had the lowest burden at 43%, followed by the FCT at 48% and Taraba at 49%.
Food has felt more expensive for many Nigerians. Nigeria’s food inflation stood at 16.1% in April 2026, and the cost of a healthy diet shows how much pressure households have faced over the past two years.
Healthy diet costs rose fastest in Nigeria’s North-West. All seven North-West states recorded increases above the national average of 49%, with Katsina, Sokoto, Kaduna, Kano, Zamfara, Kebbi, and Jigawa all rising by more than 70%.
In Katsina, a healthy daily diet that cost about ₦700 per adult in April 2024 required about ₦1,400 by March 2026. Kogi saw almost the same shift, while Sokoto, Kaduna, Kano, and Zamfara also recorded increases above 80%.
At the other end, Akwa Ibom recorded the lowest increase at 5%, followed by the FCT at 9% and Oyo at 13%.
At the national average, one adult’s monthly healthy diet would take about two-thirds of Nigeria’s ₦70,000 minimum wage.
In March 2026, the average cost of a healthy diet was ₦1,541 per adult per day. Over 30 days, that comes to ₦46,230, or 66% of the minimum wage before rent, transport, utilities, healthcare, and other household expenses.
The burden was highest in Ekiti, where one adult’s monthly healthy diet would take 90% of the minimum wage. Imo followed at 88%, while Abia, Lagos, Ebonyi, and Bayelsa were all above 80%.
Adamawa had the lowest burden at 43%, followed by the FCT at 48% and Taraba at 49%.
GTCO had the strongest profit conversion among listed Nigerian banks reviewed in 2025, turning 40.3% of gross earnings into profit after tax.
That means for every ₦100 GTCO earned, about ₦40 became profit. Stanbic IBTC followed with ₦33.5, while Wema Bank and Jaiz Bank each converted about ₦29 of every ₦100 earned.
The ranking shows that bigger earnings did not always mean stronger profit conversion. Zenith Bank recorded the highest profit after tax in absolute terms at ₦1.04 trillion, but converted 24.8% of gross earnings into profit.
First HoldCo had the lowest conversion rate, with only ₦4.1 of every ₦100 earned becoming profit after tax.
Among Nigeria’s listed banks, Jaiz Bank recorded the highest staff-cost-to-revenue ratio in 2025, spending nearly ₦18 on staff for every ₦100 of revenue.
Ecobank Transnational Incorporated (ETI) followed at 16%, while UBA ranked third at 12.2%. At the other end, GTCO recorded the lowest ratio at 4.7%, followed by Fidelity Bank at 5.3% and Zenith Bank at 7.0%.
In absolute terms, ETI had the largest staff cost at ₦782.8 billion, followed by Access Holdings at ₦504.2 billion and UBA at ₦376.3 billion.
GTCO had the strongest profit conversion among listed Nigerian banks reviewed in 2025, turning 40.3% of gross earnings into profit after tax.
That means for every ₦100 GTCO earned, about ₦40 became profit. Stanbic IBTC followed with ₦33.5, while Wema Bank and Jaiz Bank each converted about ₦29 of every ₦100 earned.
The ranking shows that bigger earnings did not always mean stronger profit conversion. Zenith Bank recorded the highest profit after tax in absolute terms at ₦1.04 trillion, but converted 24.8% of gross earnings into profit.
First HoldCo had the lowest conversion rate, with only ₦4.1 of every ₦100 earned becoming profit after tax.
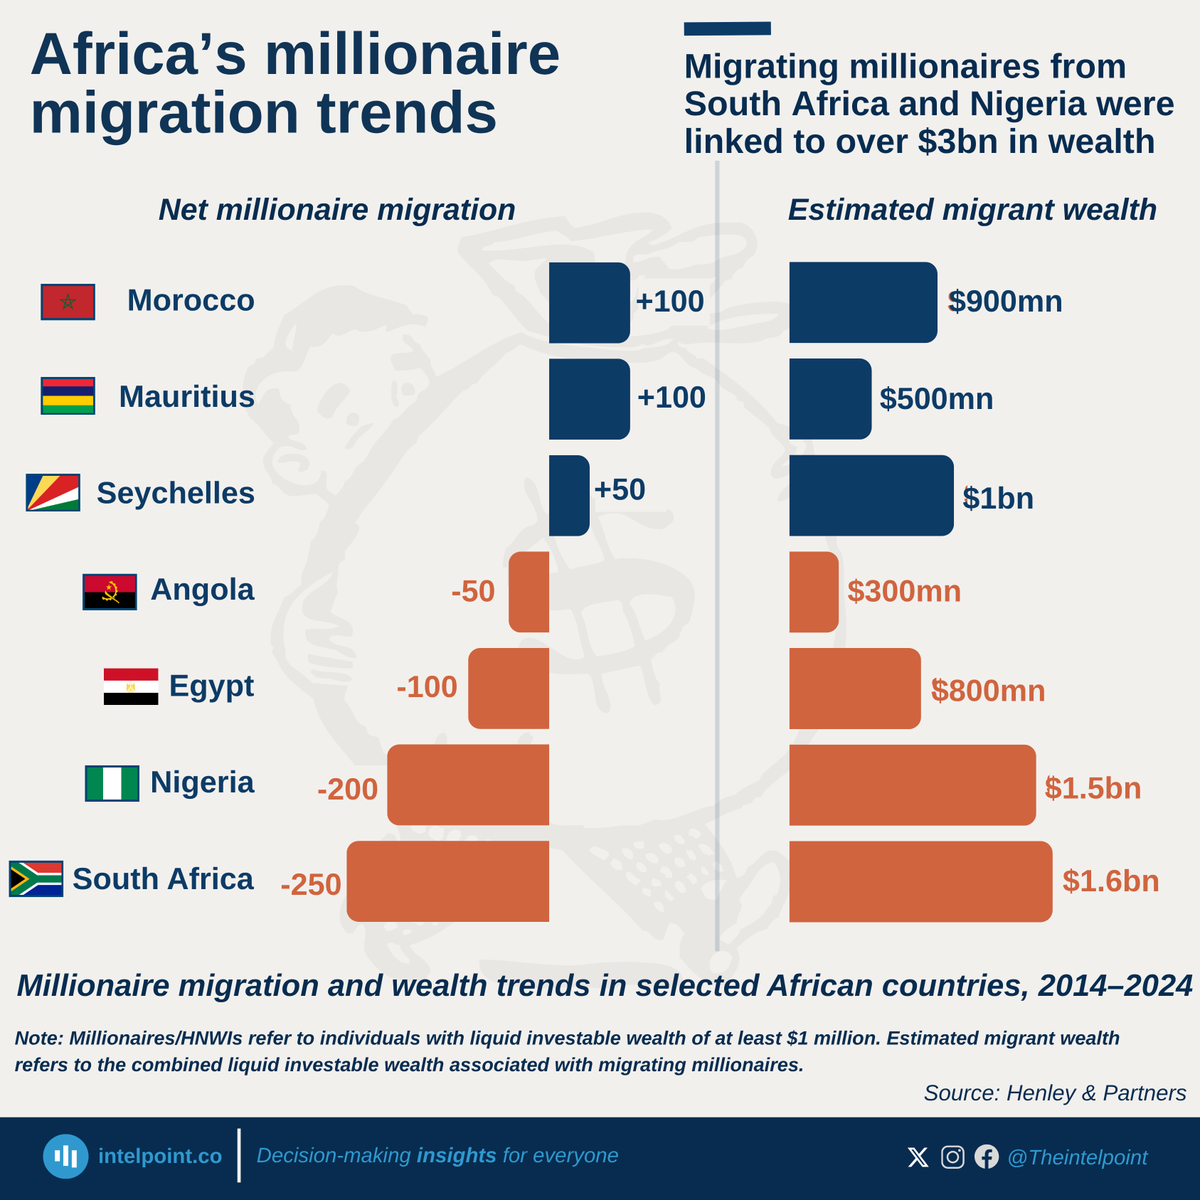
An estimated $1.5 billion in wealth was linked to migrating Nigerian millionaires between 2014 and 2024.
The country recorded 200 more millionaire departures than arrivals over the period, while South Africa recorded Africa’s largest net millionaire outflow, with more than 250 departures than arrivals linked to an estimated $1.6 billion in wealth.
On the opposite end, island economies emerged as some of Africa’s strongest wealth magnets. Mauritius and Seychelles together recorded net inflows linked to an estimated $1.5 billion in wealth.
Notably, Seychelles attracted a more concentrated pool of wealthy migrants, drawing an estimated $1 billion from just 50 more millionaire arrivals than departures, compared to Mauritius’ estimated $500 million from a net inflow of more than 100 millionaires.
Among Nigeria’s listed banks, Jaiz Bank recorded the highest staff-cost-to-revenue ratio in 2025, spending nearly ₦18 on staff for every ₦100 of revenue.
Ecobank Transnational Incorporated (ETI) followed at 16%, while UBA ranked third at 12.2%. At the other end, GTCO recorded the lowest ratio at 4.7%, followed by Fidelity Bank at 5.3% and Zenith Bank at 7.0%.
In absolute terms, ETI had the largest staff cost at ₦782.8 billion, followed by Access Holdings at ₦504.2 billion and UBA at ₦376.3 billion.
Africa's most economically powerful countries are not necessarily its most structurally capable.
Nigeria and Egypt — two of the continent's five largest economies by GDP — rank 167th and 129th globally on productive capacity, well below much smaller economies like Mauritius (56th) and Seychelles (68th).
According to @UNCTAD's Productive Capacities Index 2024, which measures eight foundations an economy needs to sustain and grow: human capital, natural capital, energy, transport, ICT, institutions, private sector development, and structural change, no African country ranks in the global top 50.
Closing the gap will require African governments to direct more investment into the foundations that drive long-term capacity, rather than relying on natural resource revenues alone.
An estimated $1.5 billion in wealth was linked to migrating Nigerian millionaires between 2014 and 2024.
The country recorded 200 more millionaire departures than arrivals over the period, while South Africa recorded Africa’s largest net millionaire outflow, with more than 250 departures than arrivals linked to an estimated $1.6 billion in wealth.
On the opposite end, island economies emerged as some of Africa’s strongest wealth magnets. Mauritius and Seychelles together recorded net inflows linked to an estimated $1.5 billion in wealth.
Notably, Seychelles attracted a more concentrated pool of wealthy migrants, drawing an estimated $1 billion from just 50 more millionaire arrivals than departures, compared to Mauritius’ estimated $500 million from a net inflow of more than 100 millionaires.
Global oil consumption has more than tripled since 1965, rising from about 30.9 million barrels per day to 101.4 million barrels per day in 2024.
But the regional map of demand has changed even more. Asia Pacific grew from about 10.7% of global oil consumption in 1965 to 37.9% in 2024, becoming the world’s largest oil-consuming region.
Africa’s oil use also grew sharply, but its global share remained small. The continent moved from 1.9% of global consumption in 1965 to 4.5% in 2024, staying below 5% for six decades.
Over six decades, global ginger production has been led overwhelmingly by India, which has consistently outproduced every other country by a wide margin. In 2021, India set a record with over 2.2 million metric tonnes harvested, more than triple the output of Nigeria, its closest rival.
Despite the gap, Nigeria has emerged as the world’s second-largest producer, overtaking traditional players like China and Nepal.
Yet, the global ginger landscape remains concentrated, with just five countries accounting for the vast majority of total output. Meanwhile, production trends have been anything but stable, with sharp year-on-year fluctuations highlighting the sector’s exposure to environmental, economic, and policy shifts.