🚨 If higher rates kill gold…
…why did gold survive one of the biggest rate-hiking cycles in history?
If lower rates create gold…
…why was it already in a secular bull market before they arrived?
A ~580% move through opposite rate regimes suggests one possibility:
The market may be arguing about the accelerator while ignoring the currency leaking out of the fuel tank. 🪙📈🧠
The dollar is not the safe side of this trade.
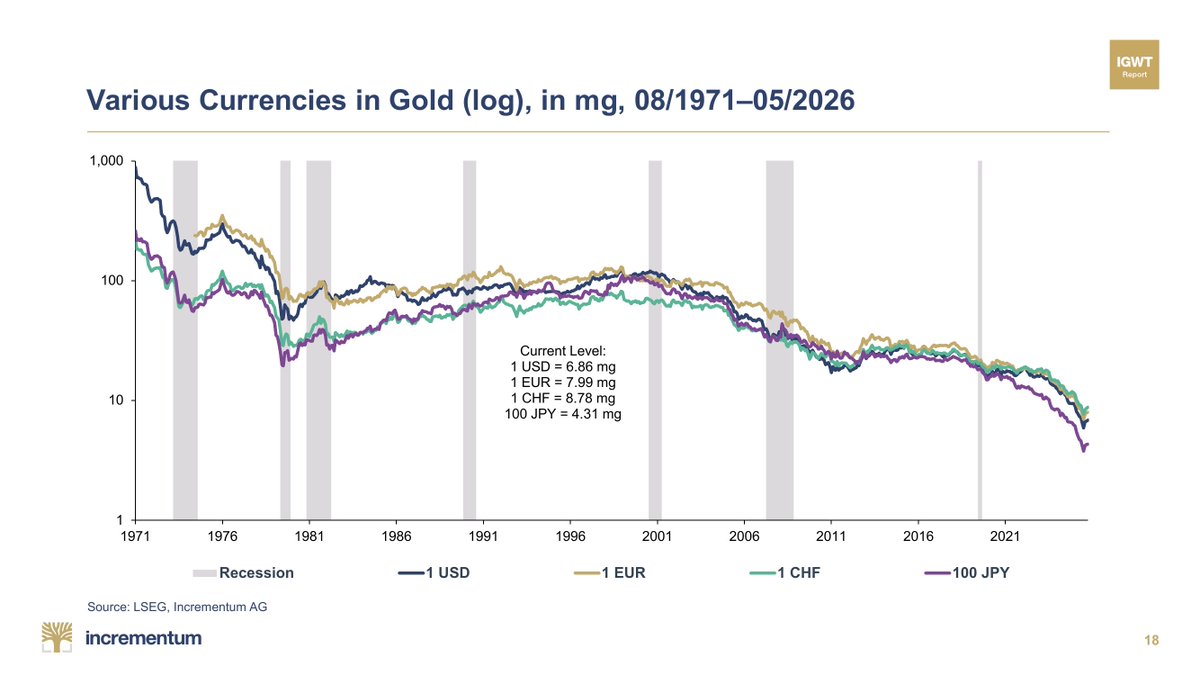
JPY looks weak against USD, but both have lost roughly 95% against gold since 2000.
Gold is the only constant.
XAUUSD .
🚨 GOLD IS ABOUT TO TRAP EVERY SELLER! 😱 MASSIVE MOVE LOADING? 📈🔥
For the last two weeks, gold has been under continuous selling pressure, which has caused many traders to panic sell. The big question now is whether gold will continue its decline this week or if we are about to see a reversal. Let's break it down in detail.
To be honest, the area from which gold found support last week is likely to act as a temporary support zone for now. If you study gold's price action throughout this year, you'll notice a recurring pattern: whenever an important support level breaks, the market often stages a short-term recovery before continuing its larger trend. This usually happens because the market needs to attract buyers and create fresh liquidity before making its next move.
Recently, gold broke our important $4024 support level. After that breakdown, the market spent some time consolidating around the $4000 area before finally showing a strong upside move on Friday. In my opinion, this wasn't a random bounce. The $4000 level is a major psychological price, and once it broke, many traders aggressively jumped into short positions expecting a much larger decline.
The market then pushed higher to trap those late sellers. At the same time, buyers started stepping back into the market, which is another reason why we saw strength after the consolidation. Because of this, I believe gold still has the potential to move higher in the short term, mainly to trap the traders who randomly entered selling positions last week and are still holding them.
One of the biggest reasons behind my bullish short-term view is the overall market psychology. The last time gold broke the $5000 level, we witnessed a major sell-off. That previous move has made many traders extremely aggressive around the $4000 area, with most expecting another significant decline after the recent breakdown. However, I don't believe the market will repeat the exact same behavior this time. Instead, I think it will first focus on trapping those aggressive sellers before deciding its next major direction.
Last week itself, I noticed several signs of a potential sell trap. From Monday onwards, the market never swept any significant highs and continued forming lower highs throughout the week. Even Tuesday's opening was below $4200, and from there gold experienced a straight decline. On Friday, the market closed around $4096, which is just below the important psychological level of $4100.
Markets often attract a large number of traders near psychological levels, especially before the weekend, because many prefer to build overnight positions with stop losses placed around those round numbers. Looking at last week's overall behavior, I have very little doubt that a large number of traders entered overnight short positions near Friday's close.
What's interesting is that on Monday, gold started moving lower again without first sweeping last week's high. This strongly suggests that those overnight sellers are still confidently holding their positions. Whenever I see this type of positioning, my attention immediately shifts toward the possibility of a seller trap. Markets often move against the majority before making their real directional move, and I believe that's exactly what could happen this week.
Because of this, my overall bias remains bullish above $4020. As I mentioned last week, the $4084 level is extremely important. If the market can hold above $4020 and then deliver a strong close above $4084, I believe sellers could get trapped very quickly, leading to a sharp zig-zag upside move. Once that confirmation arrives, the market should have enough momentum to begin a stronger directional rally.
Overall, I'm expecting gold to eventually move towards the $4280 region in the coming sessions. The only condition for this bullish outlook is that the market continues holding above $4020 and successfully reclaims $4084 with a convincing close. If both conditions are met, I believe we could see a very clean upside move from there.
You can add this paragraph naturally near the end of your analysis, just before the conclusion:
As for my Monday trading plan, it's very straightforward. As I've mentioned before, the $4025 level is extremely important. As long as gold remains above this level, my overall bias stays bullish. The $4034-$4044 zone is my primary support area, and I'll be looking for buying opportunities there with proper confirmation.
At the same time, if you're a conservative trader, I'd recommend avoiding trades between $4044 and $4067 because, based on the current price action, momentum remains choppy within this range and the market can easily produce false moves. However, if gold delivers a strong breakout above $4067 with solid momentum, I'll be comfortable buying the breakout and will look to target the $4080, $4096, and $4128 levels. The only thing I want to see before chasing those targets is a clean breakout supported by strong bullish momentum.
I hope you found this analysis logical and helpful. Wishing everyone a profitable week ahead.
As always, I'd love to know your view as well—what's your plan for gold this week? Are you bullish, bearish, or waiting for confirmation? Let me know in the comments! ⬇️
Every Fed Cycle Produced a Different Dollar
Three decades of history tell one consistent story.
There is no universal relationship between Federal Reserve rate cuts and the U.S. Dollar Index.
The early-1990s recession, the dot-com bust, the Global Financial Crisis, the 2018 slowdown, and COVID-19 all produced dramatically different currency outcomes.
Sometimes the dollar strengthened during easing.
Sometimes it weakened sharply.
Sometimes it barely moved.
The difference wasn't the Fed—it was the broader macro backdrop: global growth, capital flows, international monetary policy, and investor expectations.
Anyone making simplistic predictions that "Fed cuts equal dollar weakness" is ignoring decades of historical evidence showing that currency markets are driven by relative—not absolute—economic performance.
Fiat currencies are in an eternal bear market against gold:
Since 1971, the US Dollar has lost -99.24% of its value against gold, the 2nd-largest decline among major currencies.
Over the same period, the British Pound has declined -99.57%.
The Euro would have lost -99.08% against gold if it had existed since 1971.
Furthermore, the Japanese Yen and Swiss Franc have dropped -98.27% and -96.07%, respectively.
Meanwhile, gold prices in US Dollar terms are up +11,119% over the same timeframe.
Own assets or be left behind.
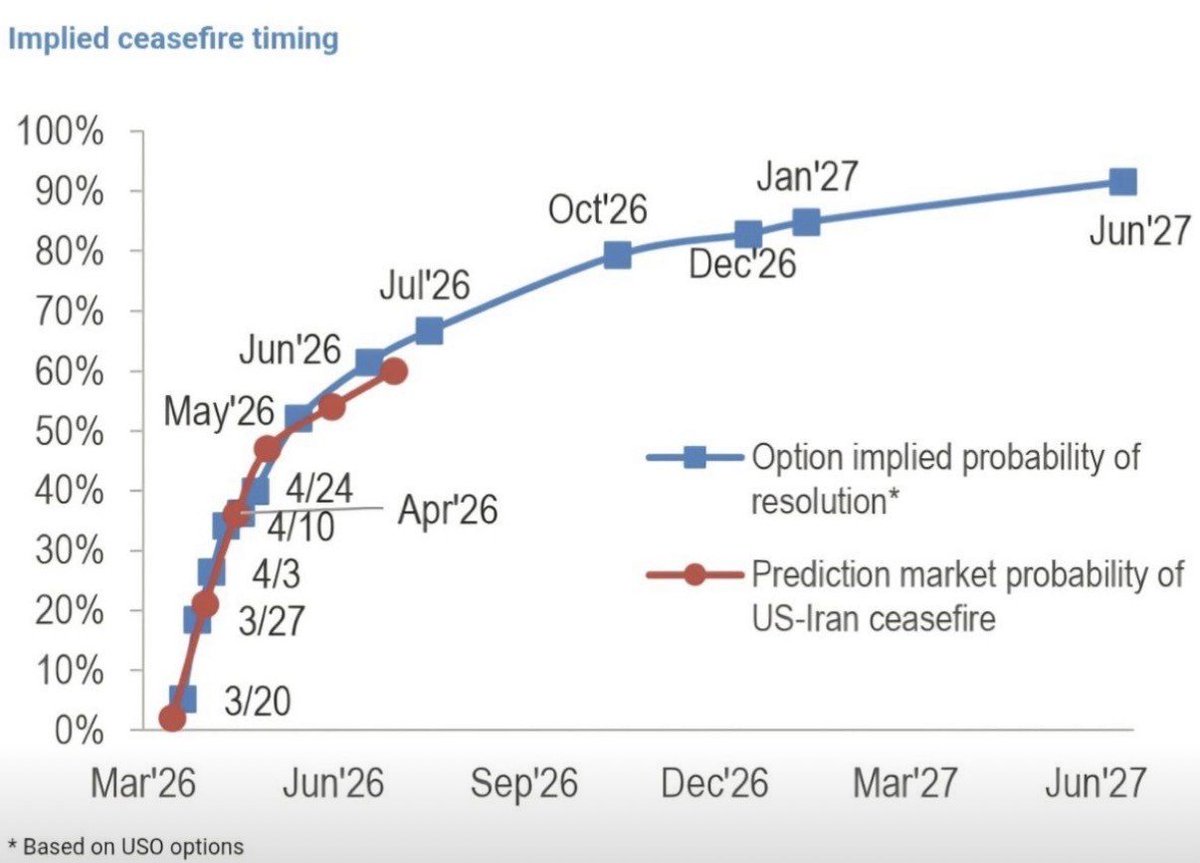
The market-implied pricing of a ceasefire only goes above 50% in May - quite a while from now still.
Some supply chains should show stress before that.
📉 Oil vs. S&P 500...
Correlation: 96%
• Oil ↑ = Equities ↓
• Oil ↓ = Equities ↑
• Oil spike = inflation shock + growth risk
• Higher energy costs hit margins and consumers
• Markets price policy tightening or demand destruction
Right now, oil is the macro driver.
If oil breaks higher → equities struggle.
If oil cools → risk assets bounce.
🚨In my latest article I revisit The Merchant’s Portfolio and update the valuation scenarios for the most oil exposed positions.
The upside becomes very clear if crude stays elevated longer than the market expects.
Read the full breakdown, here👇
https://t.co/vviAKIiicK
#oott
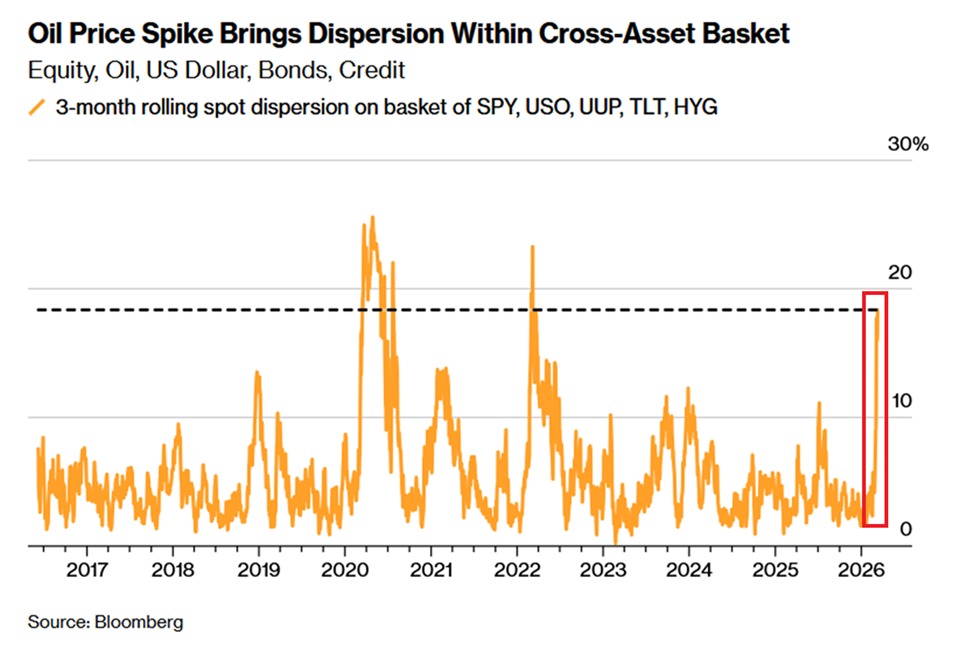
Major asset classes are moving in completely different directions:
The 3-month dispersion across US equities, oil, the US Dollar, bonds, and credit is up to ~18%, the highest since the 2022 bear market.
This measures divergence in price of major asset classes, with higher readings signaling that traditional correlations are breaking down.
Dispersion has surged ~15 percentage points since March 1st.
Over the last 10 years, higher levels of dispersion have only been seen in 2020 and 2022.
Current market conditions are extremely unusual.
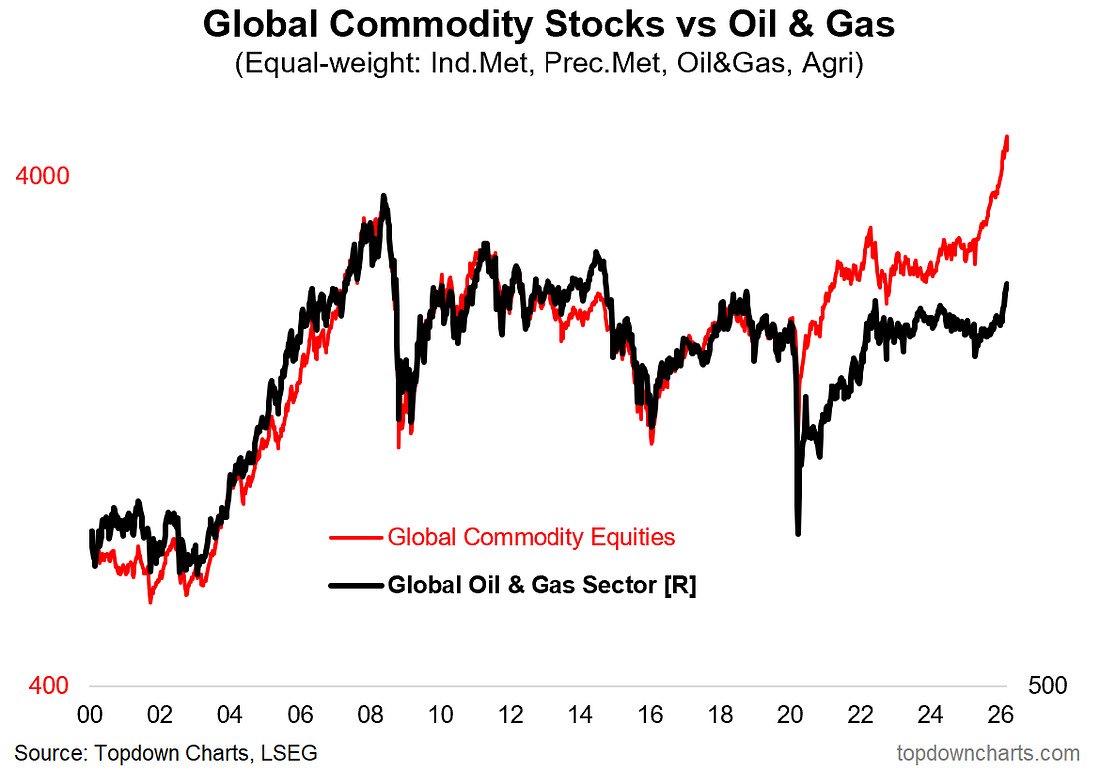
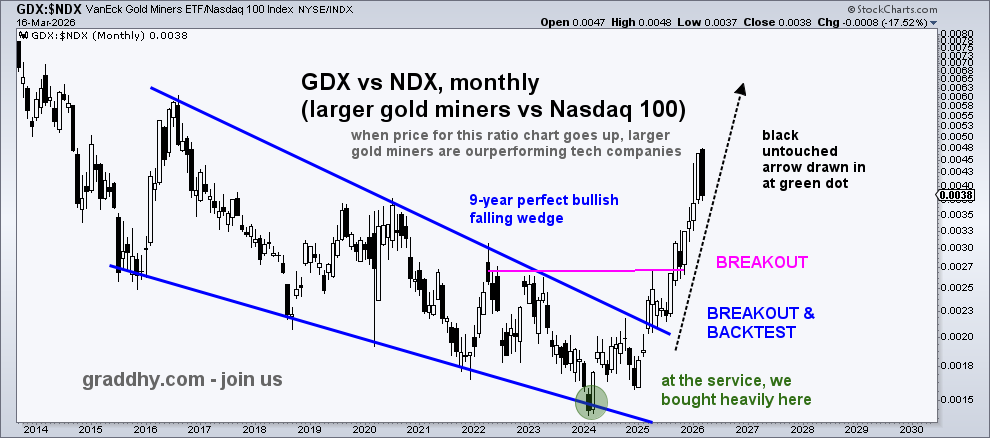
Been saying for many years that capital is now rotating into commodities.
Been posting e.g. these historical big ratio chart turns, plus their breakouts, in real-time.
The commodities bull is end of rainbow stuff.
And, down the road, commodities will be the only game in town.
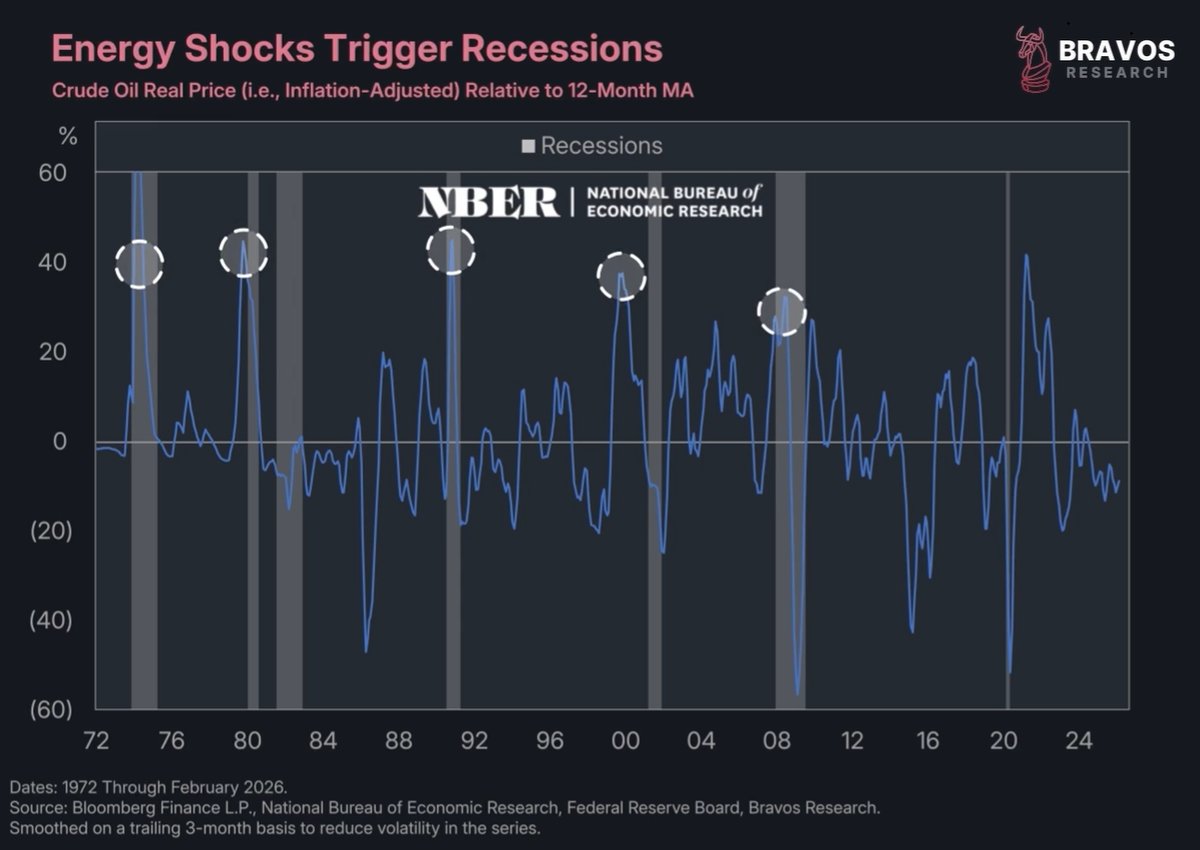
"Historically, there is a rather worrying correlation between oil prices and recessions. In fact, most serious US economic downturns have been preceded by a sudden spike in energy prices – including 1974, 1981, 1990, 2001 and 2008"
@darioperkins@TS_Lombard
Major oil shocks have systematically triggered economic recessions
The only exception was 2022, when the consumer was still resilient
Is this time different?
A thread 🧵
Financial Impact of the War 🌍💰
2-week impact on few major indicators around the world
🛢️ Crude Oil +40.8%
🔋 Natural Gas +14.4%
💵 Dollar Index +2.5%
🪙 Gold −3.5%
🇦🇪 Abu Dhabi Exchange (FTSE ADX General) −9.3%
🥈 Silver −10.5%
🇦🇪 Dubai Real Estate Index (DFMREI) −28.7%
Note: Returns between Feb 28th to March 13th 2026
Source: Trading Economics