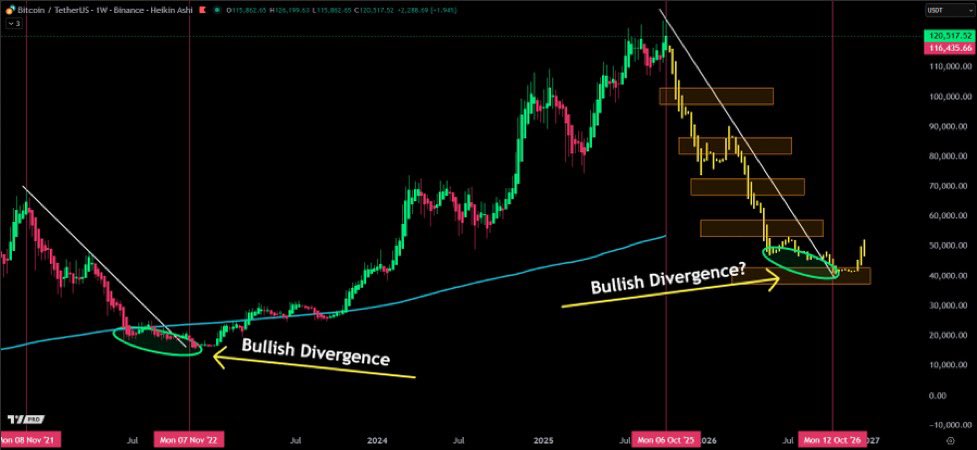
Assuming this is the #Bitcoin peak, and it doesn't mirror the previous cycle, expect different chart patterns.
However, some patterns may repeat:
- Price gets volatile at creates wicks at the peak
- Bearish divergence at the top
- Price retests the blue line
- Price retests the
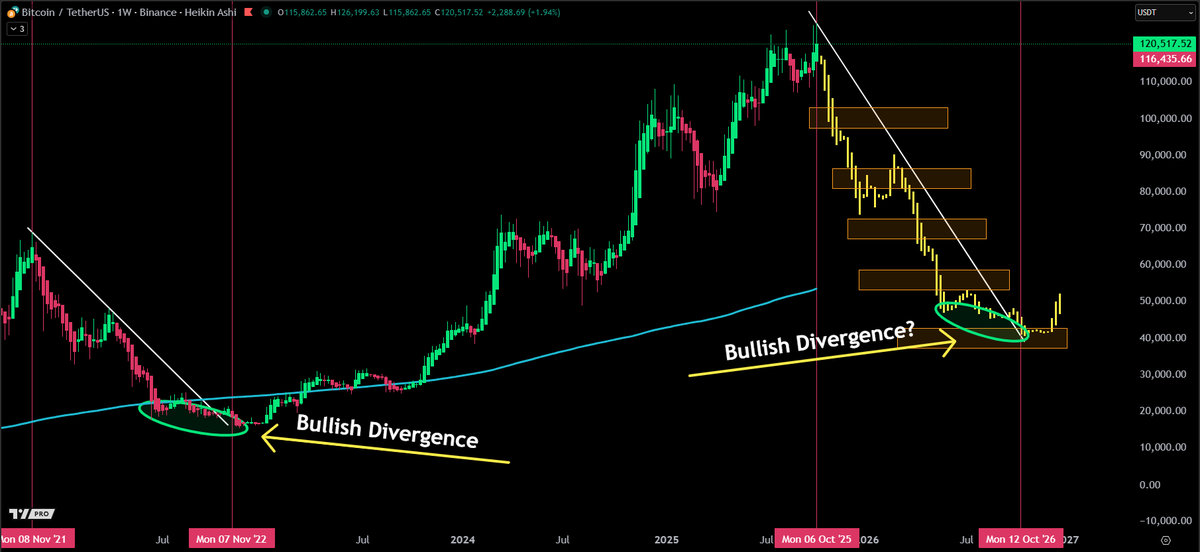
Assuming this is the #Bitcoin peak, and it doesn't mirror the previous cycle, expect different chart patterns.
However, some patterns may repeat:
- Price gets volatile at creates wicks at the peak
- Bearish divergence at the top
- Price retests the blue line
- Price retests the 5th target box
- Bullish divergence at the bottom
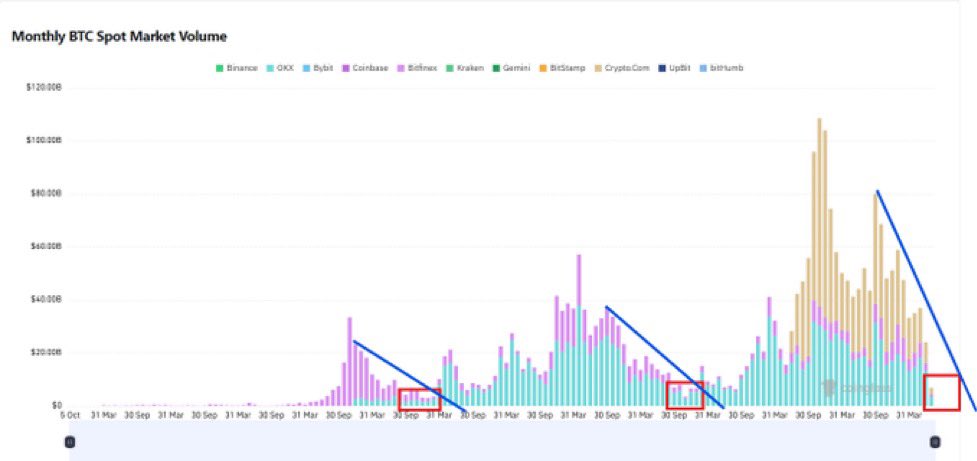
$BTC monthly spot market volume continues to decline.
Once volume increases, then the next bull run will begin.
We are getting close but not quite yet.
$BTC average buy price has dropped to $51,963.
Price has retested and gone below the pink line in every bear market so far.
The bottom is still not in.
$LINK hit all four targets on the daily chart. ✅
Possible we see a buy signal on the weekly chart this candle or next.
Is the bottom in or just longer rally?
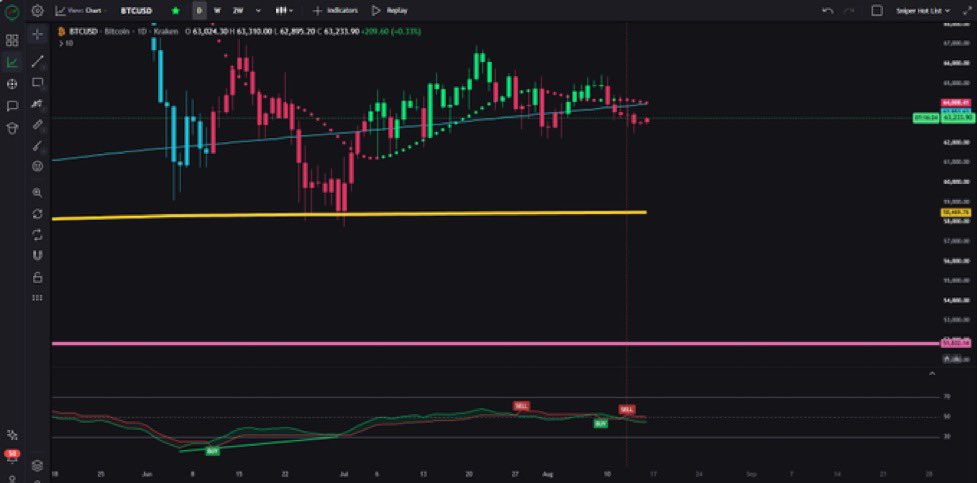
$BTC continues to trend lower on the daily chart.
Today will be the sixth consecutive candle close below the blue line.
Probabilities keep stacking of price retesting the yellow line.
$BTC has bottomed near 900 days every bear market.
Day 847 and here is what we learned:
Super cycle ❌
5 year cycle ❌
M2 Global Fractal ❌
Never sell Bitcoin ❌
Business cycle ❌
Jesse Olson charts ✅
I've covered the bear market every step of the way. 👊
$BTC continues to drop below the blue line.
Sequence: Blue -> Yellow -> Pink -> __________
Bottom callers are about to be proven wrong, again.
What comes after pink line?
$SPCX continues to live in my simulation.
Trending dots to be retested and are currently at $127.
I saw several posts of people buying $145 and that could turn out to be a bull trap.
$BTC continues to go sideways indefinitely................. 😅
RSI just printed another sell signal and the trending dots are about to cross the blue line too.
Odds keep increasing of price retesting the yellow line and then the pink line.
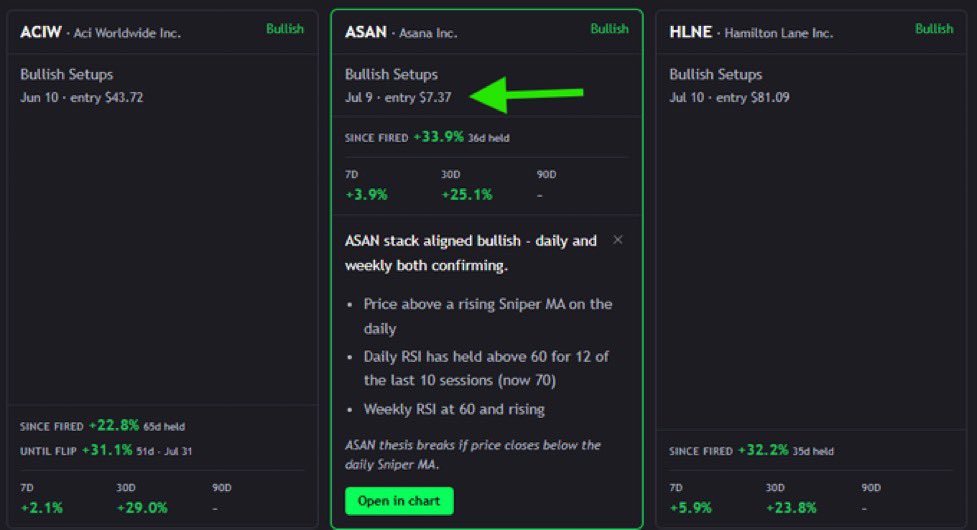
$ASAN fired an alert at $7.37, current price is $9.87, and is up +33% within 25 bars.
All bullish and bearish set-ups are tracked on our recon page as shown below.