In trading… everyone knows that execution is the hard part!
Everyone can chart levels and form a bias. That’s literally child’s play and to be honest most people can do it fairly well.
But when it comes to the actual execution of the trade we all know the difficulty increases dramatically!
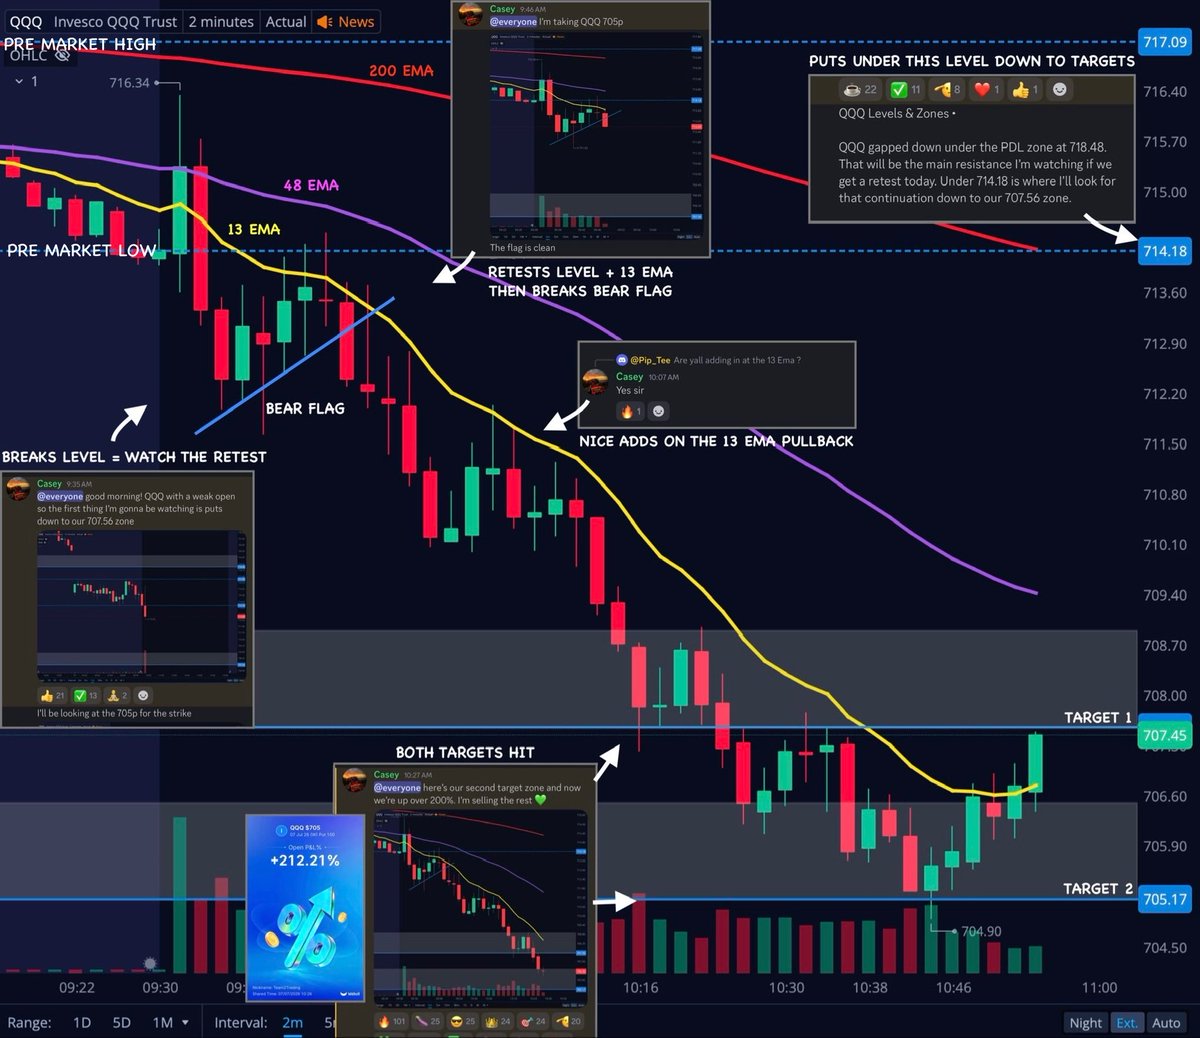
And that is the exact reason I’m posting my trades like you see below.
This is not just an “entry alert”!
This is having enough confidence in my system to actually say…
“here’s what I’m watching”
“here’s where I think it’s going”
“here’s exactly when I’m getting in”
All in real time.
So if you want to take a parade lap around some vague level you posted about. Have at it.
But around here you actually know what my plan is and when I take the trade.
And win or lose. I know people appreciate that kind of thing 🤙
How to create an unbiased game plan for trading $SPY using levels & zones 📝
I would like to show you the before and after from our pre market prep this morning.
Every day there are high quality areas for both long and short opportunities.
Chart them out. And wait for them to trigger.
Follow the levels. Not your bias 🤙
The best traders have accepted the fact that they will never be perfect.
Perfection is not required in trading. And searching for it will keep you unprofitable forever.
If you’re gonna be a successful trader you better get used to taking losses, missing trades, selling early, ect…
Because these kind of things happen every single week to the best in the world!
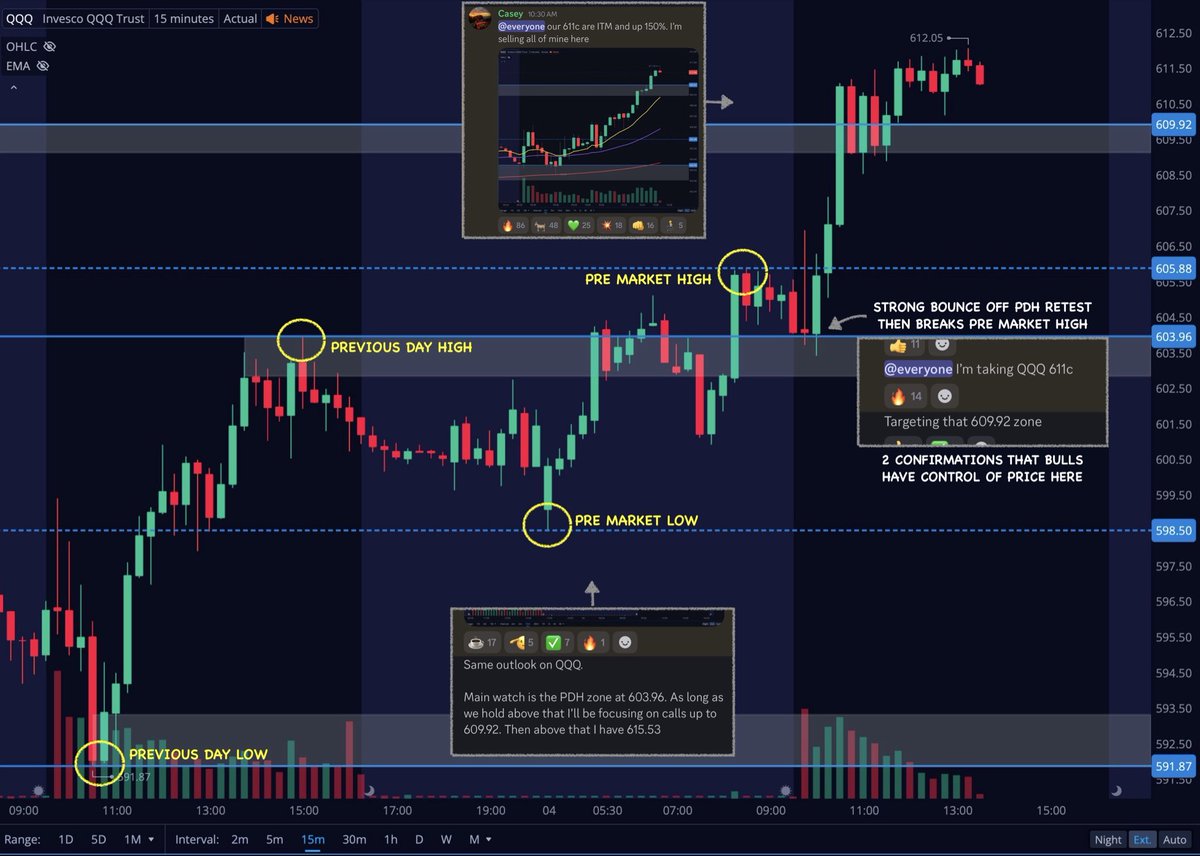
Check out this area of bullish confluence on $QQQ today…
Above key levels (PDH + PMH) ✅
Bullish EMA’s fanning out ✅
Bull Flagging structure ✅
This is what a textbook setup looks like!
When everything aligns it truly is a magical thing. This is where the big trades come effortlessly without having to force them 🪄
Anytime I find myself lacking patience and taking sub par setups I am quickly reminded that I have the best system out here 🙏
Just need to relax and let it deliver 🤙
How’s the July P&L curve looking?
The curve is where the data is.
Any rule breaking shows up right here.
Yolo’s, fomo, oversizing ect… all stare you right in the face on your P&L curve.
Once you commit to the process you realize quickly that slow is smooth, and smooth is fast 🤙
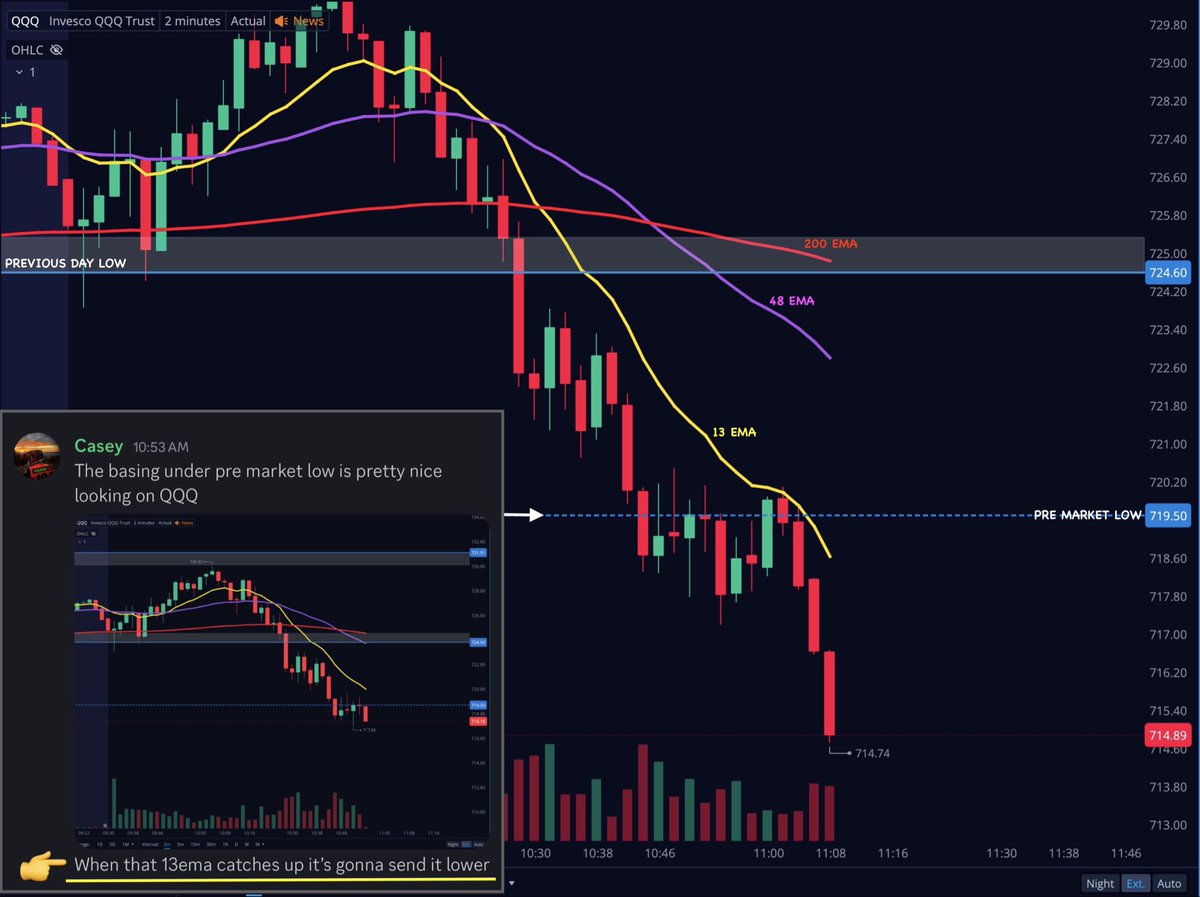
Yesterday our $QQQ puts ran 10x!
We were in that downtrend so early and I got a lot of questions about how we did that because $SPY looked so strong in the morning.
So here a quick tip on divergencies👇
If SPY is moving up and hitting resistance while QQQ is moving down and breaking support then the confluence is to the downside.
So even though at the time SPY was moving up and QQQ was moving down. There was actually alignment between the 2 names for a downside move.
In that scenario we want to play the weaker name (QQQ) to the downside.
Hope that helps 💚
The recipe for a great breakout trade is multiple wicks at a key level ✅
Anytime you see multiple wicks at a key level keep it on watch for that candle close entry later on 👀
Often times these deliver a quick 0 drawdown rocket ride 🚀
*Tip… Anytime you play a breakout you should trim / sell into the strength because we will typically see a retest of the level later 🤙
Example on $QQQ today ⬇️
This Indicator has told you when to BUY and SELL in every market the last 30 years
Listen and Follow this if you want to become Rich from the stock market.
Since 1996, every major $VIX spike above 40 has been followed by a positive 3-year $SPY S&P 500 return.
The VIX is one of the best sentiment indicators I use.
Here’s how I use it:
1) VIX <20 → Overconfidence
• Markets feel calm
• Bull markets often live here
• Stay selective
2) VIX 20–30 → Rising Volatility
• Volatility is increasing
• Expect larger swings
• Focus on quality setups
3) VIX 30–40 → Fear
• Corrections are often underway
• Historically, strong forward returns have often followed
4) VIX >40 → Panic
• Rare occurrence
• Historically one of the best long-term buying zones
• Start buying positions, not panicking
We are currently in “Trim Positions” zone. This means to hold winners and trim positions in them.
This will be your guide moving forward. Keep this with you. Do not lose it.
Here’s my blueprint for day trading 📝
$SPY $QQQ $IWM
Mark these 4 levels ✍️
Previous Day High ✅
Previous Day Low ✅
Pre Market High ✅
Pre Market Low ✅
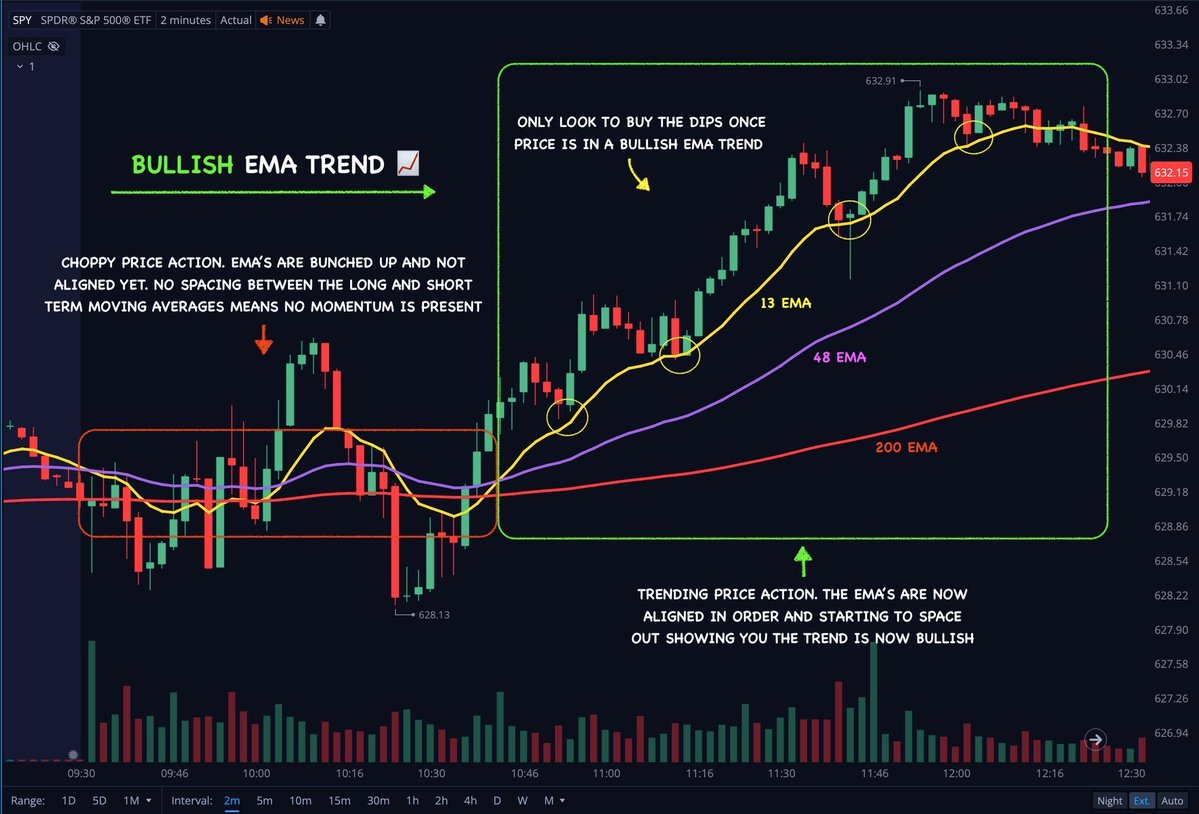
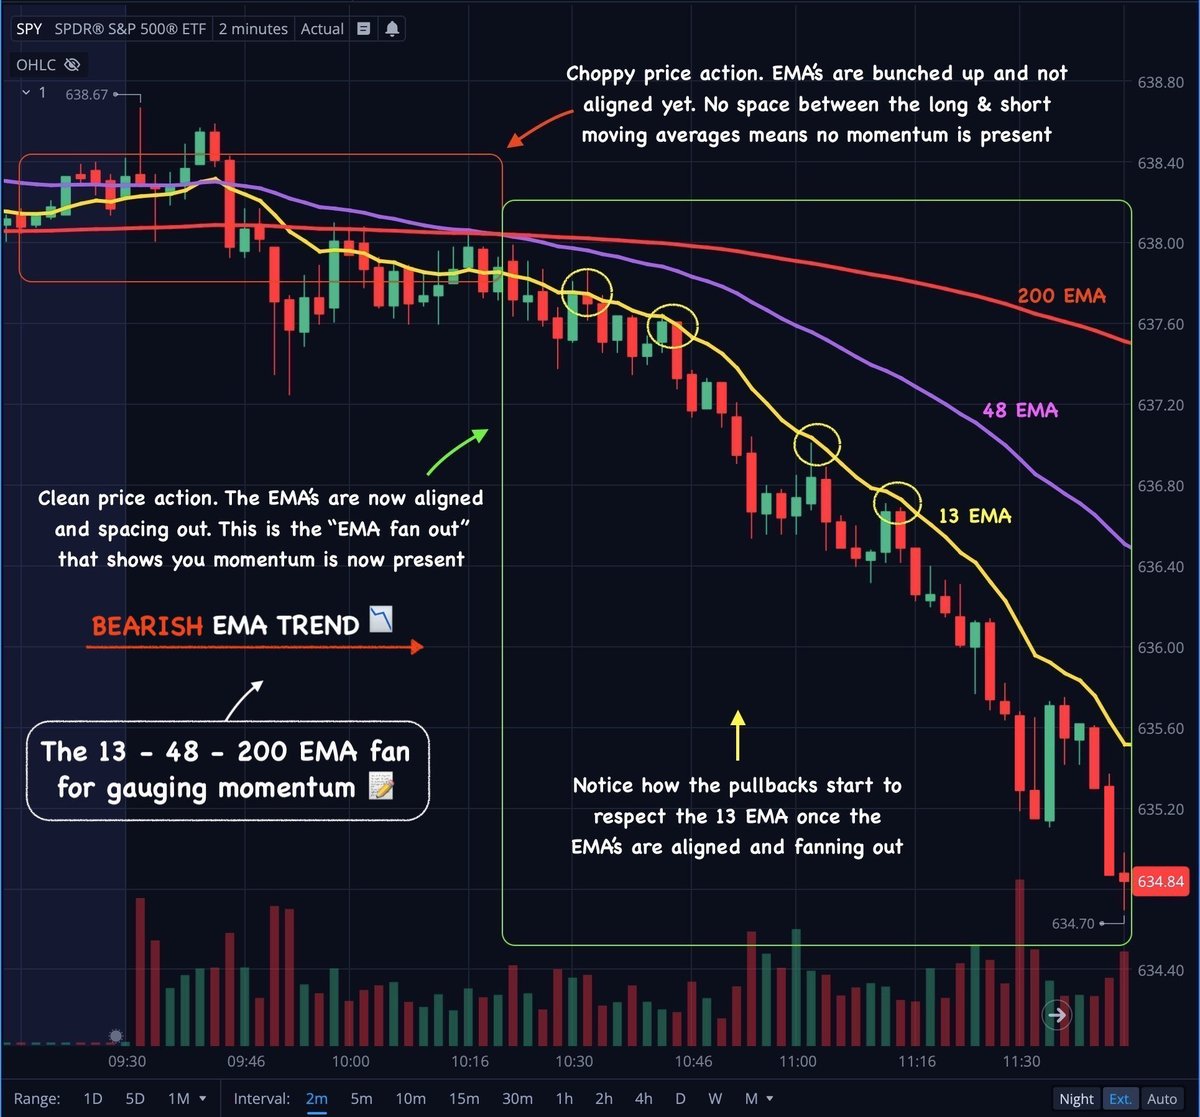
Add these EMA’s to your chart 📊
13 EMA 🟡
48 EMA 🟣
200 EMA 🔴
Study these simple patterns 🏳️
Bull flags 📈
Bear Flags 📉
Focus on break & retest trades that align with the EMA trends. Bull / Bear flags are bonus points.
1 or 2 trades a day. Small size. Base hits.
Follow this for 1 month and watch the discipline turn you into an absolute beast!
Then SLOWLY start to size up.
You’re welcome 💚
Trading is a career that takes a long time to develop. 95% of traders quit when the beginners luck wears off. The people who find success are the ones who refuse to give up
Trading is also a career that can help you build generational wealth for your family & their future families. No matter what your current financial situation is, building a trading system with a true edge can change it
Once you've built that system, you can execute it from anywhere on the planet. Hotel on the beach while your wife drinks a Mai Tai? Yep. On your phone in a car while riding to your kids sporting event? Yep.
Trading is one of the only things in the world that can truly set you free
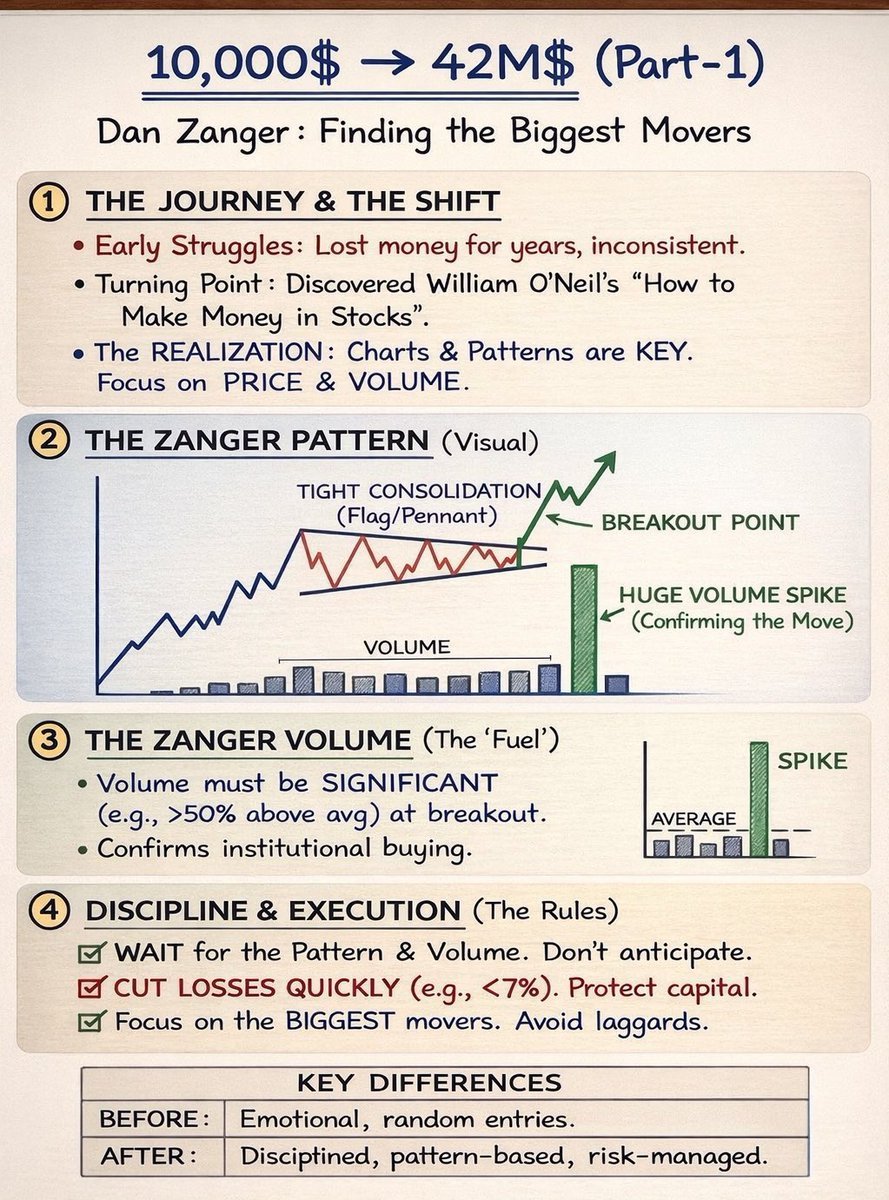
DAN ZANGER THE WORLD TRADER.👇📊
•Dan Zanger is best known for turning approximately $10,000 into over $42 million.
•This performance was achieved in less than two years, making it one of the most
documented and respected trading records in modern market history.
•His results were independently verified and later featured in Investor’s Business Daily (IBD).
Early Trading Years
•Zanger lost money consistently for many years.
•He struggled with emotional trading, random entries, and lack of structure.
•The major turning point came when he studied William O’Neil’s methodology, especially the book How to Make Money in Stocks.
The Breakthrough Insight
Dan Zanger realized one critical truth:
Charts don’t lie. Price and volume tell the real story.
From that moment:
•He stopped predicting.
•He stopped fighting the market.
•He focused purely on high-probability chart patterns.
The Zanger Trading Method
1. Pattern Selection
•Tight consolidations (flags, pennants, bases)
•Strong prior uptrend
•Clean structure with minimal noise
2. Breakout Rule
•Entry only at proper breakout points
•No anticipation
•No early guessing
3. Volume Confirmation
•Breakouts must occur with significant volume
•Often 50% or more above average
•Confirms institutional participation
4. Risk Management
•Losses cut quickly (usually 5–7% max)
•Capital preservation comes first
•No emotional attachment to trades
5. Focus
•Only the biggest potential movers
•Avoids lagging or weak stocks
•Trades fewer stocks, but trades them well
Psychological Shift (Before vs After)
Before
•Emotional decisions
•Random entries
•Overtrading
•Hope-based holding
After
•Disciplined execution
•Pattern-based entries
•Risk-controlled trades
•Rule-based exits
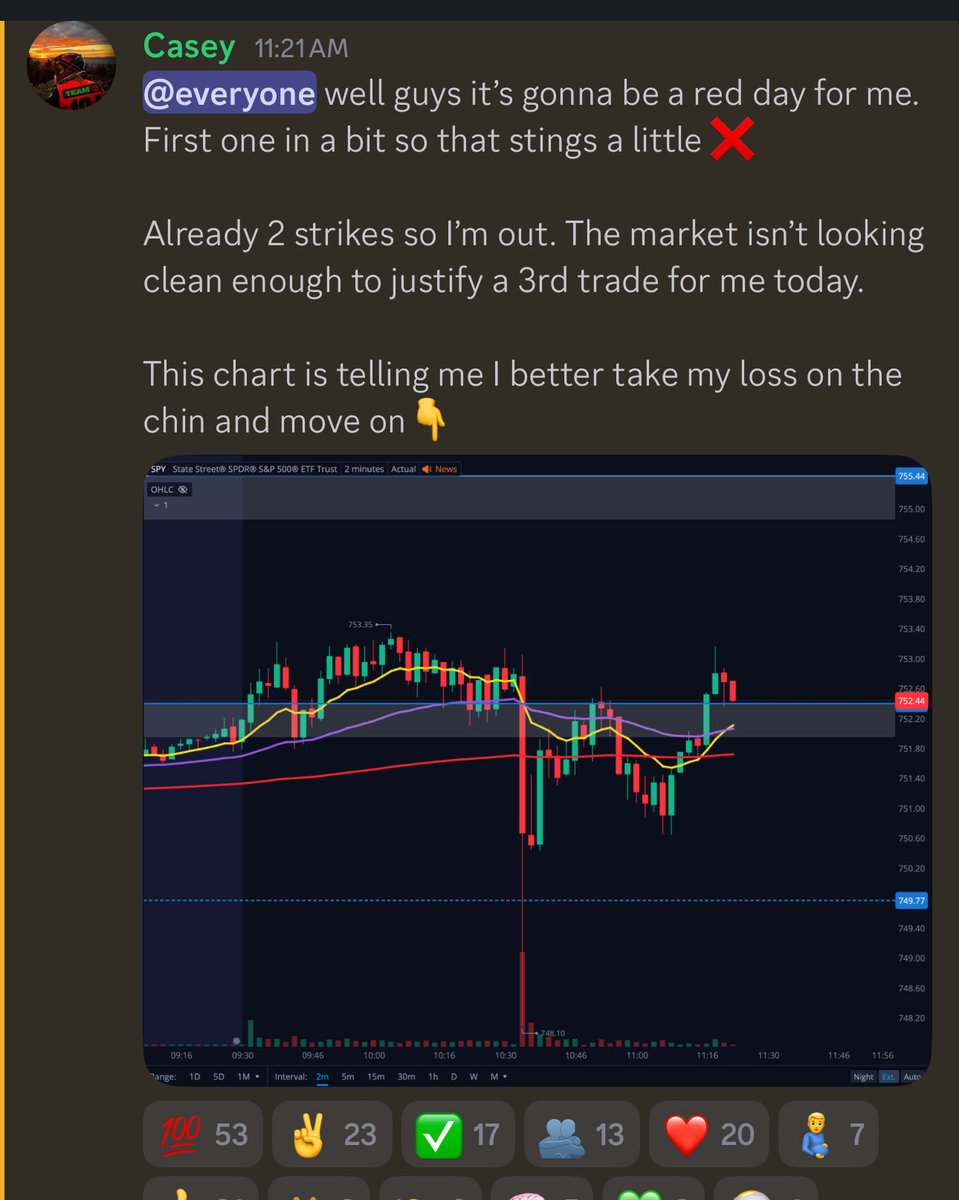
The hardest part about trading is managing your losing days.
It can be really hard to accept the fact that either (A) it’s a choppy day, or (B) you are simply sucking.
Today was probably a bit of both for me. And either way it’s best to shut it down.
Do not dig yourself a hole! There is always tomorrow 🤙
This is the reason why we are outperforming the markets together. Save this, and you'll be rich during bull markets, and you'll survive during bear markets.
- At market bottoms, financials and tech lead.
- At the top, energy and staples take over.
- In bear markets, healthcare and utilities outperform.
My cycle repeats every time.
Knowing where you are in my cycle tells you exactly where to be overweight.
Save this. Study it. Use it.
This is all you need to do to make millions in the stock market. Save this. Screenshot it. You will need it.
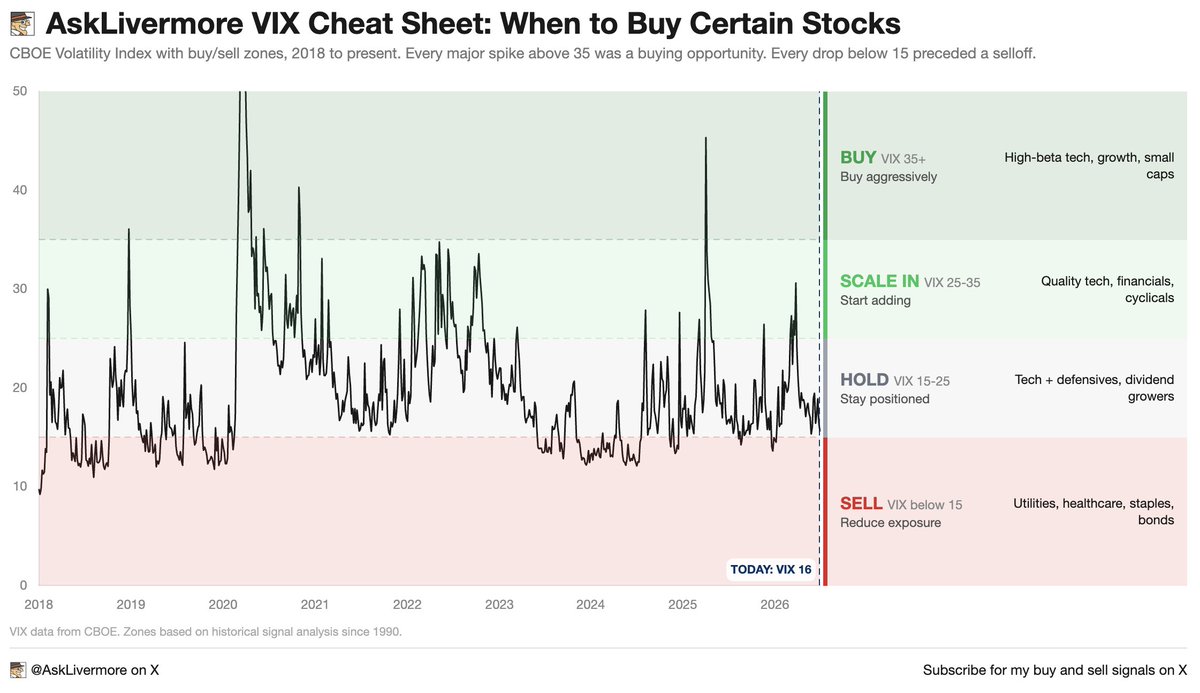
1. VIX above 35: buy aggressively
- High-beta tech, growth, small caps
- Every single time the VIX spiked above 35 since 2018 was a generational buying opportunity. COVID bottom. Oct 2022 bottom. Tariff crash. If you bought when everyone else was panicking, you made a fortune.
2. VIX 25 to 35: start scaling in
- Quality tech, financials, industrials, cyclicals
- This is where smart money starts building positions. Not all at once. Gradually. The fear is real but the opportunity is bigger.
3. VIX 15 to 25: hold
- Balanced: tech + defensives, dividend growers
- This is normal. Stay positioned. Don't chase, don't panic. Let your winners run.
4. VIX below 15: reduce exposure
- Rotate to: utilities, healthcare, staples, bonds
- This is when everyone is comfortable. Nobody is hedging. Nobody is worried. That's exactly when you should be.
- Every major crash in market history was preceded by the VIX sitting below 15 for weeks.
Right now the VIX is at 16. We're in the hold zone. Stay positioned but stay alert.
Bookmark this. The next time the VIX spikes above 35, don't freeze. Buy.
The definition of “mindset”…
“A persons habitual attitude or fixed mental state that dictates how they interpret and respond to situations.”
Profitable trading is a state of mind.
A trading strategy is just a guide for reading price action (Bias, entry, exit, etc…)
Your actual edge is you 🫵
$5,000 to $10,000 months
Slowly become
$5,000 to $10,000 weeks
Then evolve into
$5,000 to $10,000 days
Don’t rush it. Trust the process and enjoy the ride because the come up is actually the funnest part!