Earlier this month the paper "Finfluencers" was published, exploring the relationship between the performance of financial influencers, their tweeting activity, and the size of their following base.
The key findings are that there is an inverse correlation between the number of followers and the account's skill level, with the majority of these accounts consistently yielding (estimated) negative returns. Also, the more someone tweets, the less likely he is to be skilled.
Worth a read https://t.co/XHGOmUdG81
In recent weeks, the media have been full of stories about an impending financial crisis in China. Amid all the hyperbole, @gave_vincent wonders why China’s financial markets don’t seem to be signaling fresh trouble, why Chinese households continue to consume, and why commodities are holding up. And looking at developed world markets, he wonders why more isn’t being made about August’s collapse in the US treasury market. Different explanations are possible, with very different investment implications. Read the free article: https://t.co/pk5bTyc3C6
Funding Rates
The funding rate is the cost of holding an open position in a perpetual swap contract (perp).
It is usually calculated by the difference between the [price of the perpetual swap contract] and [price of a spot-based index].
If funding is positive, the perp price is trading at a premium (above) the index price. Open long positions pay funding, open short positions receive funding.
If funding is negative, the perp price is trading at a discount (below) the index price. Open short positions pay funding, open long positions receive funding.
Perps are different to standard futures contracts because there is no expiry or rollover mechanism.
This begs the question: how and why do perps generally trade in line with spot markets?
Answer: Funding.
This is a built-in arbitrage mechanism designed to incentivise traders to keep these instruments (specifically their prices) in line with one another.
For example: Perp trading meaningfully above the spot index price --> funding rate goes up.
Two things happen:
1. It becomes more expensive for long holders to keep their positions open (negative incentive).
2. Traders can buy spot, sell the perp, and collect the funding rate with minimal directional exposure (positive incentive).
The bigger the difference between the perp price and the spot price, the higher the funding rate.
Think of this as providing greater incentives to arb the difference the more out of line these instruments get from each other.
To be crystal clear, funding is primarily a product of the difference between [perp price] and [spot-based index price].
I'll also reiterate an important point from an earlier tweet: if funding is at baseline and/or there is no interesting divergence forming between price, funding, and time - you are unlikely to find an attractive setup.
All of these tools become complementary and contextually interesting when "something doesn't add up" or if they're at/near a relative extreme.
From a trading perspective, identifying divergences between funding and price can lead you closer to productive trade ideas:
1. Example: High positive funding but price is moving lower or stalling/not moving higher.
1.1. Reasonable inference: Perp longs are aggressive but are not being rewarded for it. This is potentially bearish (especially if other contextual clues present e.g. price into key resistance).
2. Example: High negative funding but price is moving higher or stalling/not moving lower.
2.1. Reasonable inference: Perp shorts are aggressive but are not being rewarded for it. This is potentially bullish (especially if other contextual clues present e.g. price into key support).
3. Example: Funding becoming more positive as price is moving lower.
3.1. Reasonable inference: Perp dip buyers are in 'disbelief' fading the move AND/OR spot traders are the aggressive sellers. This is potentially bearish (especially if other contextual clues present e.g. perp OI increasing, spot volumes and CVD leading, et cetera).
4. Example: Funding becoming more negative as price is moving higher.
4.1. Reasonable inference: Perp sellers are in 'disbelief' fading the move AND/OR spot traders are the aggressive buyers (especially if other contextual clues present e.g. perp OI increasing, spot volumes and CVD leading, et cetera).
These are just a few basic ones and you can build more setups especially if you incorporate OI + CVD where appropriate.
In essence, we're circling back to very important first principles here:
1. Who (if anyone) is being aggressive?
2. Is their aggression being rewarded?
As a final note, it's also important to understand not only what the funding rates are and their implications, but also how they came to be.
I can think of three particular examples where funding rates are misinterpreted most frequently.
1. Negative funding after an outsized move with liquidations.
As discussed, funding reflects the difference between the perp price and the index price.
Perps have higher leverage than the spot-based assets that typically make up the index. As a result, when there's a large amount of liquidations in the perp, those liquidations and messy unwinds exacerbate the size of the move.
Perps typically become more dislocated than spot at extremes, so naturally they end up trading at a discount to the index.
Accordingly, the negative funding after a wipeout does not necessarily mean that the market is short from the bottom now. It's just a reflection of perps getting hammered harder than spot because of the leverage that they offer.
2. "Spot premium".
Spot premium - where spot price of an asset is trading consistently higher than the perp or future price of an asset - can provide useful signals.
For example, during the 2021 bull run it was common to see spot exchanges like Coinbase consistently trading at a premium to perps and futures during the U.S. session.
One could reasonably see this as a reflection of risk appetite and more aggressive buyers in the spot market, which is generally a good sign.
However, this same argument was made many times on the way down from circa ~50k BTC - and it didn't quite work out.
Mechanistically, spot was leading the selling --> perps would follow --> perps get liquidated and move more aggressively than spot --> perps end up below spot --> "spot premium".
It's the same spot premium in form but completely different in substance and context.
If you will be relying on spot premium as an argument for spot demand, make sure that you have other arguments for there being demand in the market (not just the funding rate or basis).
3. Dodgy outlier altcoin (max) funding = squeeze imminent.
Particularly pertinent pattern in the second half of 2023.
It goes something like: huge price increase --> hugely negative funding --> speculators pile in the long side for continuation/short squeeze on account of the negative funding rate --> spot gets mega dumped instead and funding normalises.
For the outlier lower caps specifically, I'd be sceptical about looking into funding-oriented stuff too closely as it tends to be 'gamed' more often than not. The signals tend to be clearer on more liquid, higher cap assets.
More broadly, funding alone does not always make for a compelling argument for a squeeze.
You need to first build a prima facie credible case that the aggressors are the ones offside, ideally with some confluence via OI.
Even then, positive funding can normalise by perps closing/spot buying and negative funding can normalise by perps buying/spot selling - without any dramatic squeeze.
There are a lot of other interesting things about funding rates, but this is already quite long for an 'introductory' post.
Hope you enjoyed this one.
Thanks for reading and let me know if you want more.
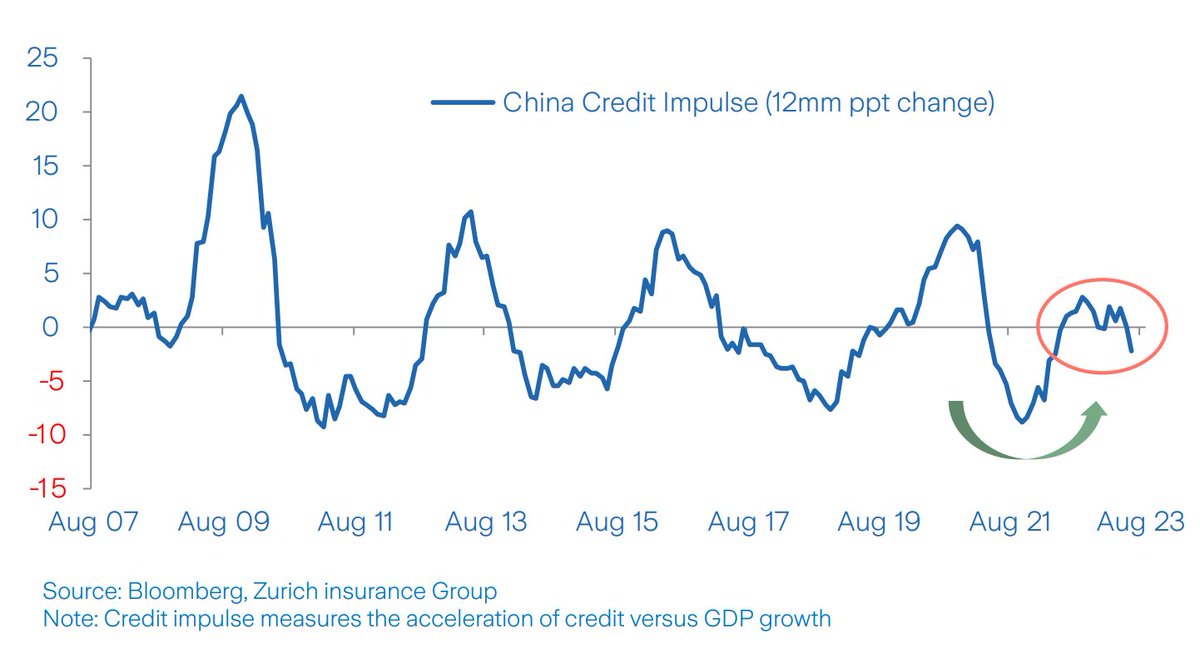
China looks to be ruling out the kind of household focused stimulus that many (myself included, but also the Dr. Cai and others in China) believe would be most effective --
largely, in a sense, on ideological grounds ...
Jens may be more bearish than I am --
No doubt that the recent run of data has been very weak.
And that the PBOC is in a bit of a bind -- cutting rates while encouraging the state banks to defend the CNY ...
1/
If you want to chart the magnificent 7 ($AAPL $MSFT $GOOGL $AMZN $NVDA $META $TSLA) in Thinkorswim or Tradingview, enter the following formula as the ticker symbol:
AAPL/1.8*0.26+MSFT/3.2*0.22+GOOGL/1.3*0.15+AMZN/1.4*0.13+NVDA/4.1*0.09+META/3.0*0.07+TSLA/2.4*0.07
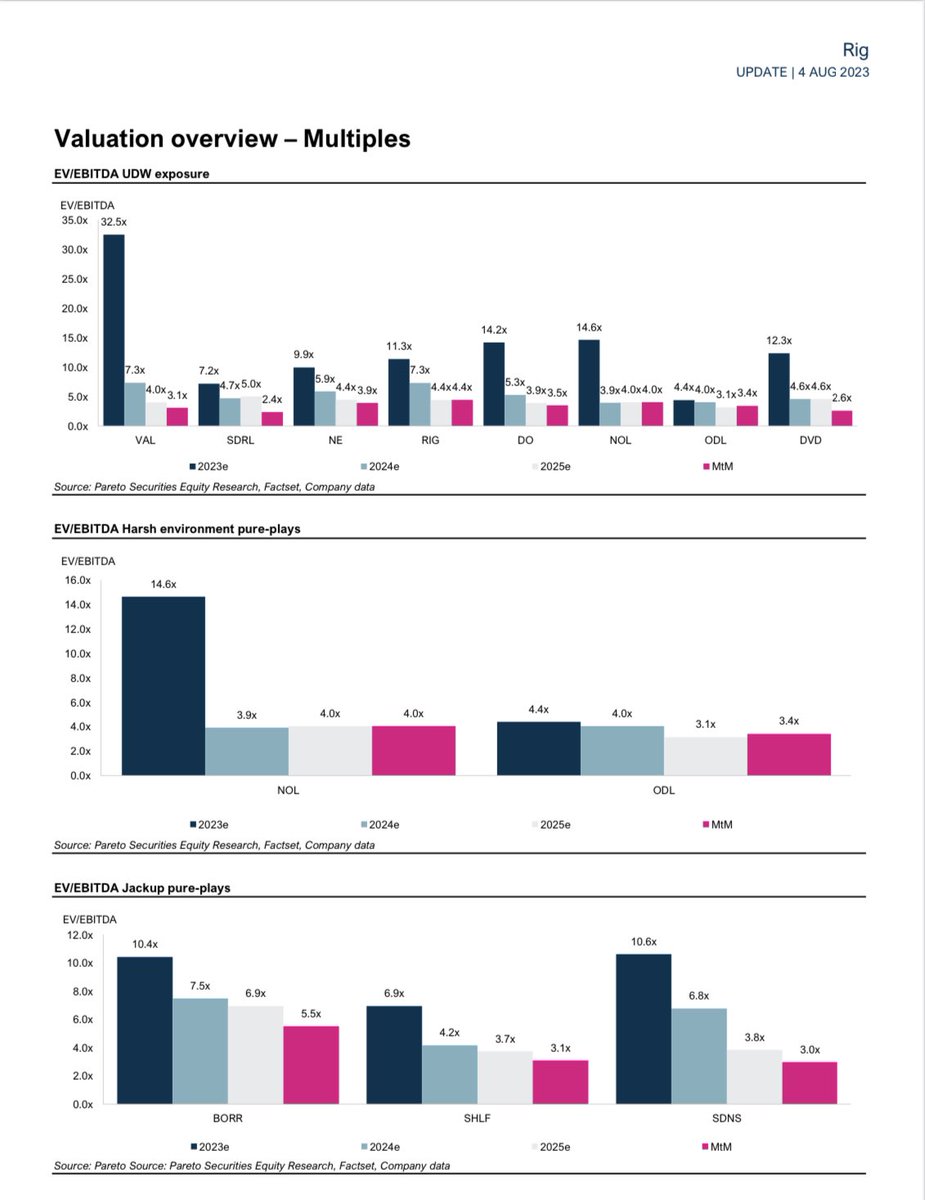
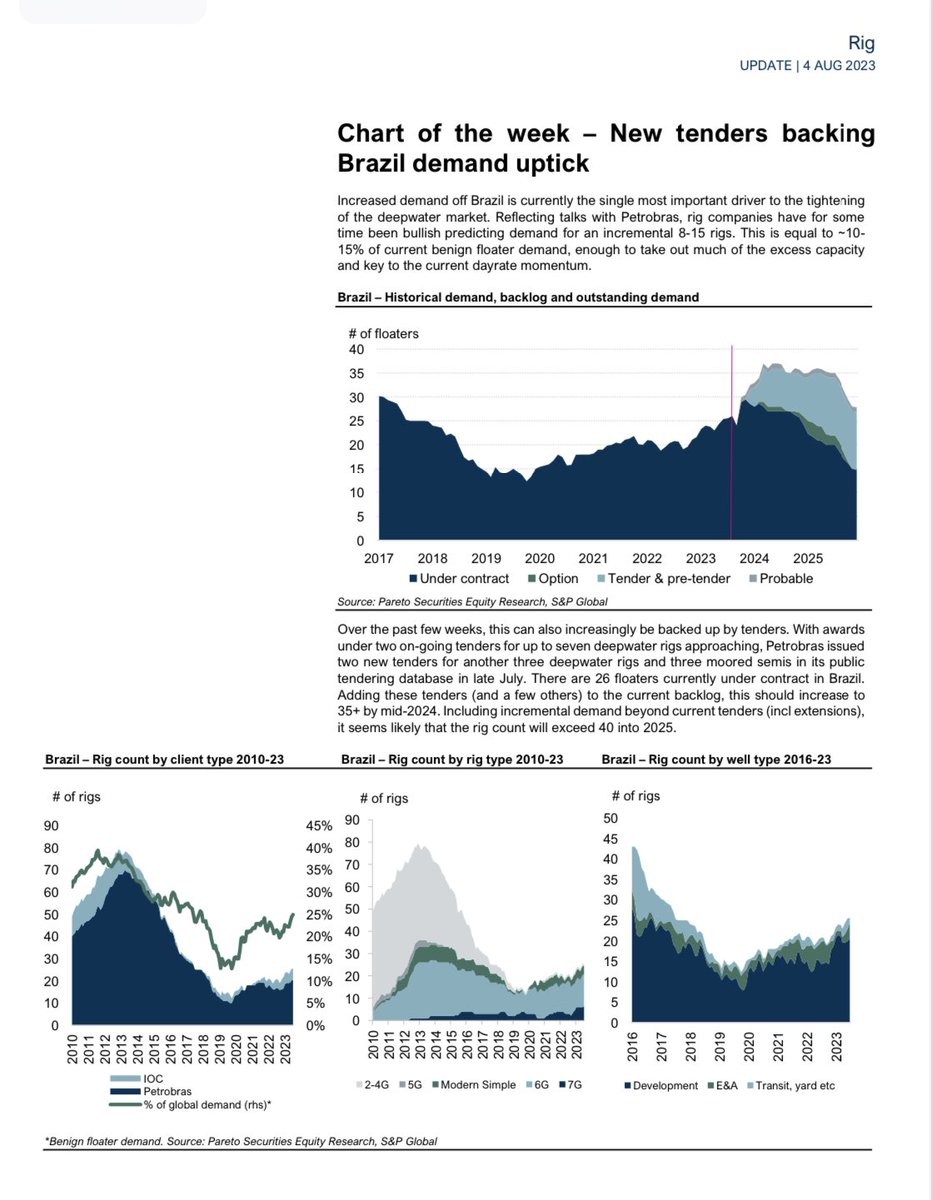
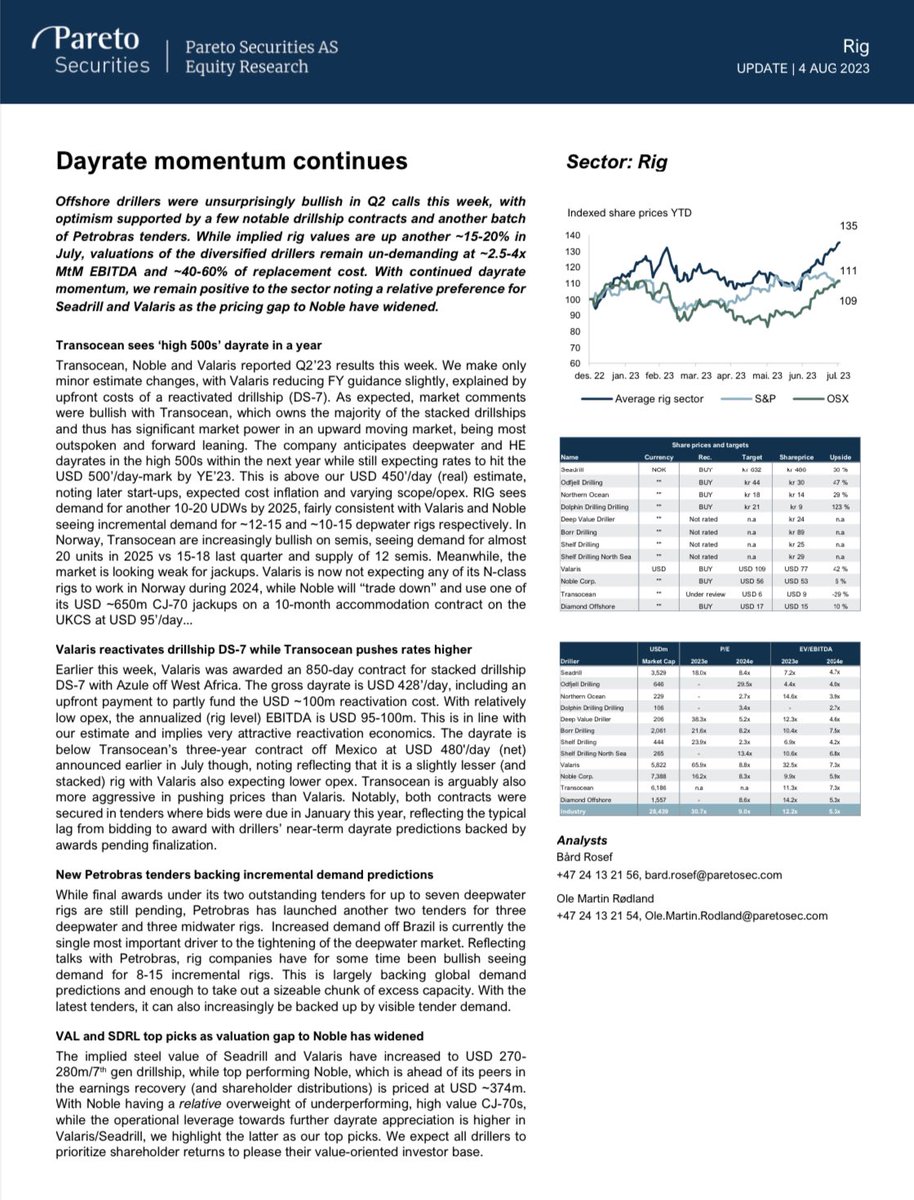
$VAL and $TDW report their 2Q results. Middle East ironically remains a sinkhole for them both - a reminder that the Gulf is not always golden for foreigners. Golden Energy PSV deal is great for Oaktree as ING botched the process, according to my sources
https://t.co/OxYPQFIPQL
PBOC attepted to fix the yuan stronger.
Indonesian Cental Bank confirms FX intervention to sell dollars.
Traders reporting Indian Central Bank RBI sold dollars.
Bill Lawry "It's all happening "
1/4
Household savings have definitely risen, Adam, although the surge in household deposits overstates this increase because there was also a substantial shift among households from riskier forms of savings (e.g. WMPs and home purchases) to plain vanilla bank deposits.
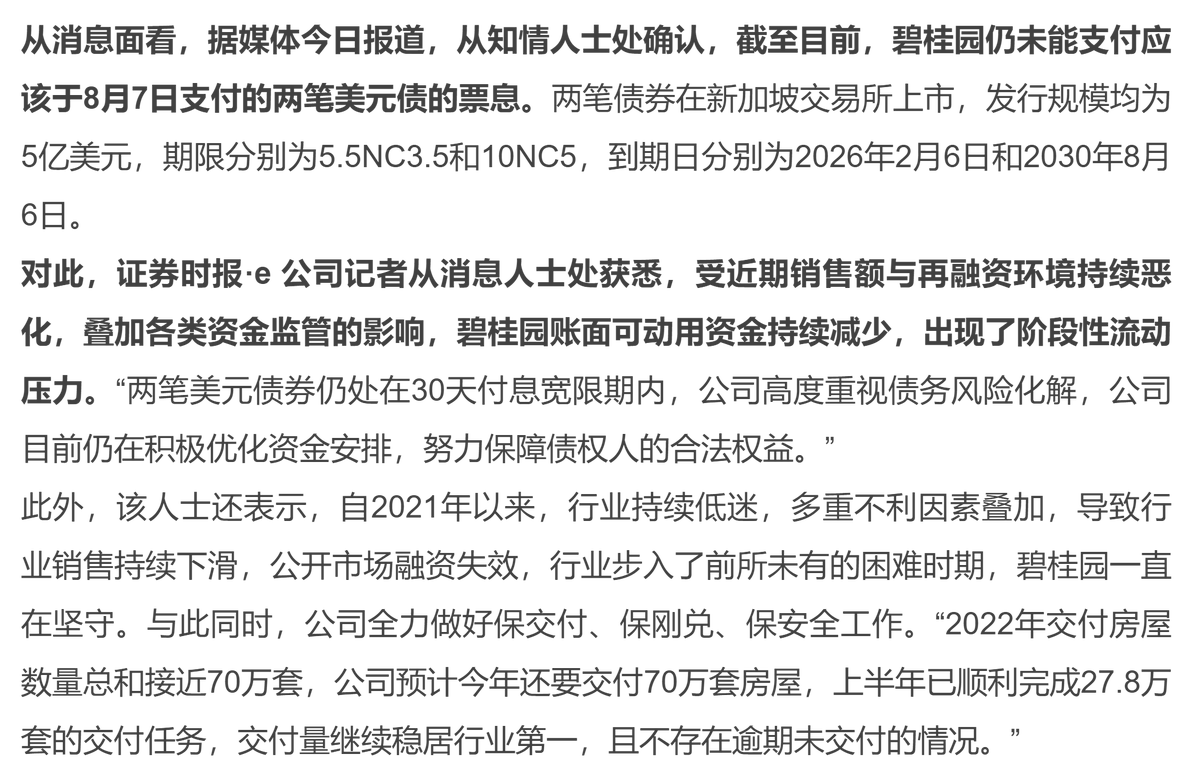
China's developer Country Garden has some liquidity problem to pay for two dollar bonds issued in Singapore.
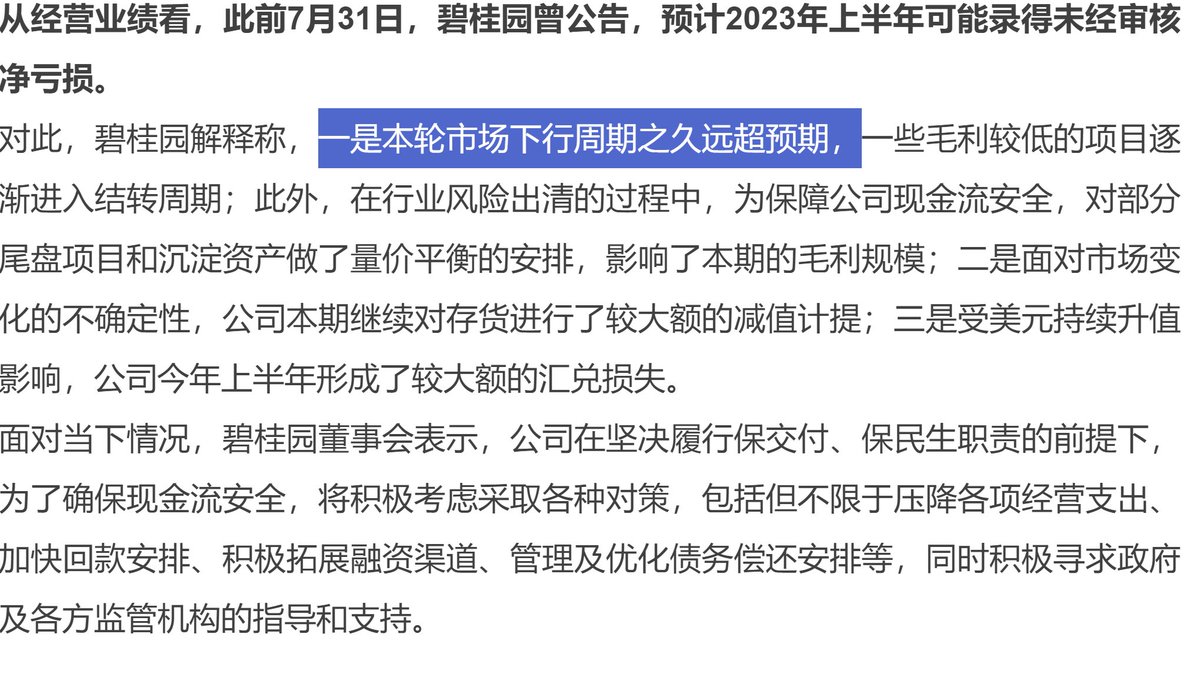
Interesting in their own assessment, "the current downturn is longer than they expected". Unfortunately for them,
https://t.co/lpxsTobffI
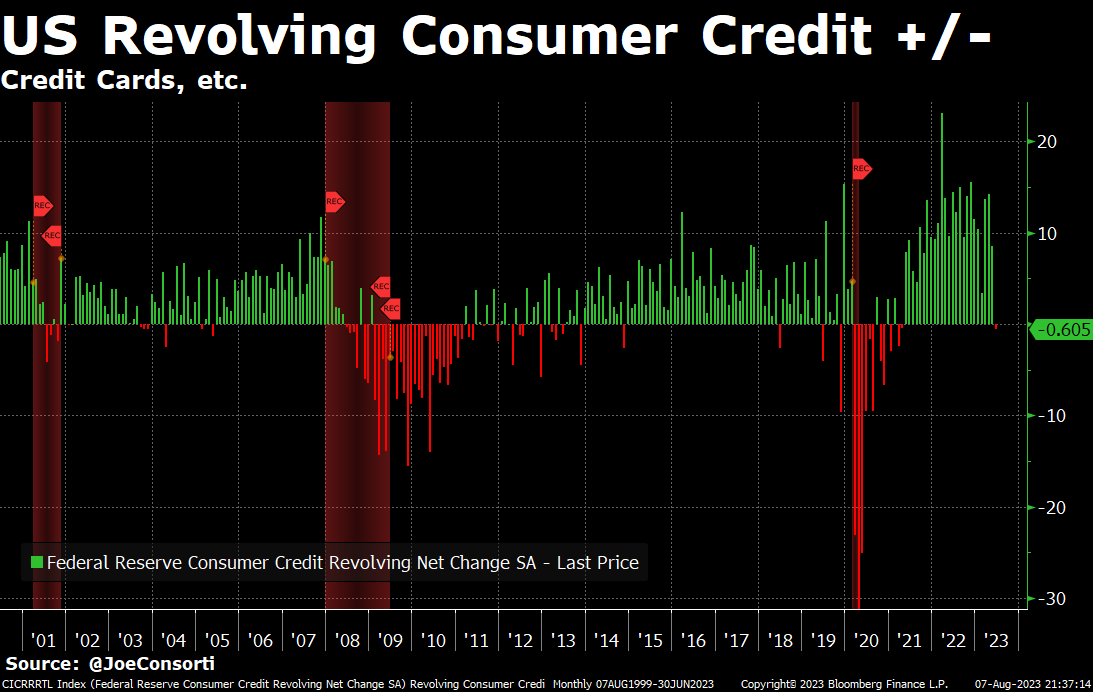
Credit card balances actually fell by $605 million for the first time in 28 months.
The red shading is recessions.
You don't have to be a pattern recognition specialist to see what happens next.








![CryptoCred's tweet photo. Funding Rates
The funding rate is the cost of holding an open position in a perpetual swap contract (perp).
It is usually calculated by the difference between the [price of the perpetual swap contract] and [price of a spot-based index].
If funding is positive, the perp price is trading at a premium (above) the index price. Open long positions pay funding, open short positions receive funding.
If funding is negative, the perp price is trading at a discount (below) the index price. Open short positions pay funding, open long positions receive funding.
Perps are different to standard futures contracts because there is no expiry or rollover mechanism.
This begs the question: how and why do perps generally trade in line with spot markets?
Answer: Funding.
This is a built-in arbitrage mechanism designed to incentivise traders to keep these instruments (specifically their prices) in line with one another.
For example: Perp trading meaningfully above the spot index price --> funding rate goes up.
Two things happen:
1. It becomes more expensive for long holders to keep their positions open (negative incentive).
2. Traders can buy spot, sell the perp, and collect the funding rate with minimal directional exposure (positive incentive).
The bigger the difference between the perp price and the spot price, the higher the funding rate.
Think of this as providing greater incentives to arb the difference the more out of line these instruments get from each other.
To be crystal clear, funding is primarily a product of the difference between [perp price] and [spot-based index price].
I'll also reiterate an important point from an earlier tweet: if funding is at baseline and/or there is no interesting divergence forming between price, funding, and time - you are unlikely to find an attractive setup.
All of these tools become complementary and contextually interesting when "something doesn't add up" or if they're at/near a relative extreme.
From a trading perspective, identifying divergences between funding and price can lead you closer to productive trade ideas:
1. Example: High positive funding but price is moving lower or stalling/not moving higher.
1.1. Reasonable inference: Perp longs are aggressive but are not being rewarded for it. This is potentially bearish (especially if other contextual clues present e.g. price into key resistance).
2. Example: High negative funding but price is moving higher or stalling/not moving lower.
2.1. Reasonable inference: Perp shorts are aggressive but are not being rewarded for it. This is potentially bullish (especially if other contextual clues present e.g. price into key support).
3. Example: Funding becoming more positive as price is moving lower.
3.1. Reasonable inference: Perp dip buyers are in 'disbelief' fading the move AND/OR spot traders are the aggressive sellers. This is potentially bearish (especially if other contextual clues present e.g. perp OI increasing, spot volumes and CVD leading, et cetera).
4. Example: Funding becoming more negative as price is moving higher.
4.1. Reasonable inference: Perp sellers are in 'disbelief' fading the move AND/OR spot traders are the aggressive buyers (especially if other contextual clues present e.g. perp OI increasing, spot volumes and CVD leading, et cetera).
These are just a few basic ones and you can build more setups especially if you incorporate OI + CVD where appropriate.
In essence, we're circling back to very important first principles here:
1. Who (if anyone) is being aggressive?
2. Is their aggression being rewarded?
As a final note, it's also important to understand not only what the funding rates are and their implications, but also how they came to be.
I can think of three particular examples where funding rates are misinterpreted most frequently.
1. Negative funding after an outsized move with liquidations.
As discussed, funding reflects the difference between the perp price and the index price.
Perps have higher leverage than the spot-based assets that typically make up the index. As a result, when there's a large amount of liquidations in the perp, those liquidations and messy unwinds exacerbate the size of the move.
Perps typically become more dislocated than spot at extremes, so naturally they end up trading at a discount to the index.
Accordingly, the negative funding after a wipeout does not necessarily mean that the market is short from the bottom now. It's just a reflection of perps getting hammered harder than spot because of the leverage that they offer.
2. "Spot premium".
Spot premium - where spot price of an asset is trading consistently higher than the perp or future price of an asset - can provide useful signals.
For example, during the 2021 bull run it was common to see spot exchanges like Coinbase consistently trading at a premium to perps and futures during the U.S. session.
One could reasonably see this as a reflection of risk appetite and more aggressive buyers in the spot market, which is generally a good sign.
However, this same argument was made many times on the way down from circa ~50k BTC - and it didn't quite work out.
Mechanistically, spot was leading the selling --> perps would follow --> perps get liquidated and move more aggressively than spot --> perps end up below spot --> "spot premium".
It's the same spot premium in form but completely different in substance and context.
If you will be relying on spot premium as an argument for spot demand, make sure that you have other arguments for there being demand in the market (not just the funding rate or basis).
3. Dodgy outlier altcoin (max) funding = squeeze imminent.
Particularly pertinent pattern in the second half of 2023.
It goes something like: huge price increase --> hugely negative funding --> speculators pile in the long side for continuation/short squeeze on account of the negative funding rate --> spot gets mega dumped instead and funding normalises.
For the outlier lower caps specifically, I'd be sceptical about looking into funding-oriented stuff too closely as it tends to be 'gamed' more often than not. The signals tend to be clearer on more liquid, higher cap assets.
More broadly, funding alone does not always make for a compelling argument for a squeeze.
You need to first build a prima facie credible case that the aggressors are the ones offside, ideally with some confluence via OI.
Even then, positive funding can normalise by perps closing/spot buying and negative funding can normalise by perps buying/spot selling - without any dramatic squeeze.
There are a lot of other interesting things about funding rates, but this is already quite long for an 'introductory' post.
Hope you enjoyed this one.
Thanks for reading and let me know if you want more.](https://pbs.twimg.com/media/F4N9wc0W0AAgddY.png)