📃Today, 06/12/24 I have decided to publish my most important work, The-Duck-Code—the code that forms the foundation of all financial markets.
https://t.co/wLpkQYC3EX
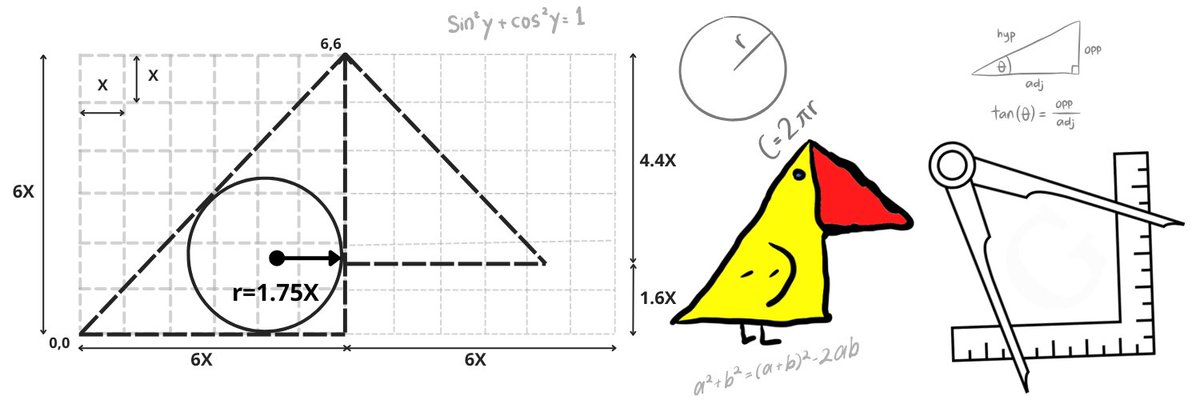
What is perhaps most remarkable about one of the most valuable codes ever devised by the human mind is its sheer simplicity. A compass, a ruler, two triangles, and a circle—these are the humble elements that define the entire financial system.
This work is dedicated to those who seek the truth, to my physics teacher, and to everyone who refuses to give up, no matter the odds.
💊Pump Fun Token Stats: The Odds of Reaching a Significant Market Cap
In the first 9 months of Pump Fun's operation (Jan–Sept), the stats from Dune show:
- Tokens launched: 2,160,378
- Tokens reaching $69k market cap: 33,560
- Graduation rate: 1.55%
This means 98.45% of tokens never make it to even a $69k market cap, which is relatively small. If you're aiming for a token to hit a significant market cap, the odds become exponentially lower.
In other words, each token has an estimated 0.01% chance of reaching a market cap significant enough to bring substantial returns to investors.
✍️These are the stats to consider when assessing the potential of new tokens.
#theduckcode #PumpFunLaunch #MemeCoinSeason
#CryptoMarket #CryptoCommunity #CryptoAnalysis #InvestmentInsights
3. Bitcoin distribution
In the case of Bitcoin, the top 0.28% of wallets hold 80% of the total Bitcoin supply.
It may seem surprising to realize that all systems are essentially controlled by a small group of individuals, but this is simply a reflection of the global distribution of wealth.
✍️ Due to this system and human behavior, market equilibrium in real-world situations is typically achieved when a very small number of long-term holders own over 60% of the total supply.
What does a perfect solution look like?
Read more 👇
#Bitcoin #bitcoindefi #theduckcode
📄Case Study on Supply Control Issues
Up until now, not many people have truly analyzed this problem in detail.
1) What does the perfect distribution look like?
2) Is it even possible in real life?
3) Market statistics.
4) The Perfect Solution for Uniform Distribution?
✍️According to the "Balloon Theory," each holder is like a balloon under the price chart. The more assets holders possess, the larger their balloon grows.
Read more 👇
#theduckcode #cryptocurrency #PriceAction #tradingstrategy #casestudy
3. Top Solana Projects
The chart compares holdings of the top 100 holders from major meme projects on Solana (verified on https://t.co/TTciIi58iI).
✍️ This trend also applies to over 500 leading projects, where the top 100 holders control over 60% of the total supply.
Read more 👇
@dogwifcoin@bonk_inu@POPCATSOLANA
#MarketEquilibrium #CryptoInvesting #WealthDistribution
@B66Paul@DUCKallOver We will continue the same organic pattern we started. We’ll keep posting analyses and case studies for the upcoming periods. We’re also bringing in new people organically to follow our experiment or join us. Thank you for your feedback!🥰
Secret
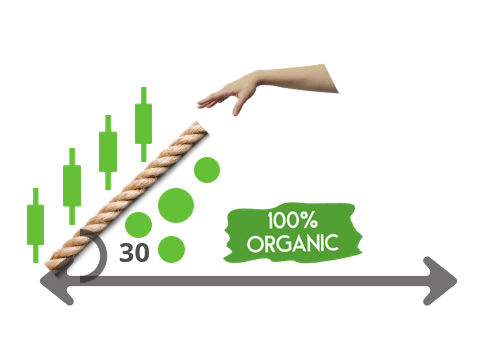
1) The key to an asset's success is its beginning; organic growth over time leads to a stable group of long-term holders.
2) In contrast, chaotic marketing draws in quick buyers who sell just as fast, ultimately leading to the asset's decline.
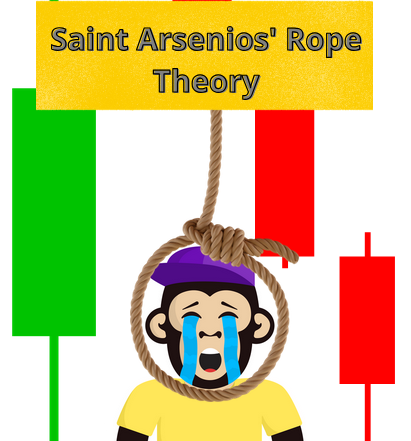
"Saint Arsenios' Rope Theory" offers a clear, insightful link between an asset's lifespan and the angles of its price chart's rise.
🌎In a world full of confusion and misinformation, many misunderstand how a project should grow. Explore below for interesting insights.
#SaintArseniosRopeTheory #SaintArseniosRope
#757Phalanxstrategy #757Phalanx
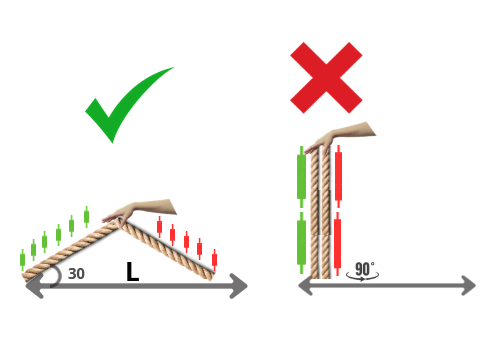
In conclusion:
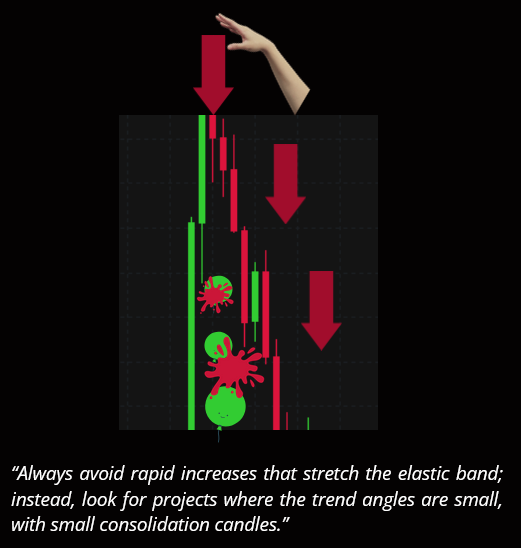
1) Steeper angles reduce an asset's lifespan.
2) Angles of 90 degrees cause immediate asset failure in 99% of cases.
3) Avoid charts with rapid increases at steep angles.
#memecoin#memecoinonsolana
Conclusion #2
When stretched quickly, buyers flood the market like balloons beneath the price chart. Once released from external forces, the elastic snaps back, popping the balloons and causing up to 95% losses for 95% of participants.
#MarketAnalysis#FinancialEducation #TradingPsychology
🪢The Paradox of Johnny Bravo's Rope
This theoretical work reveals why financial markets act like an elastic band. Market elasticity offers, for the first time, a clear explanation for large candlestick patterns, pump-and-dump cycles, and more.
Read more 👇
#JohnnyBravosRope
Conclusion #2
1) The greater the force applied to stretch an elastic band in a short time, the quicker it will snap back to its original position. This leads to the pump-and-dump cycle, which occurs at steep angles and over short periods.
#pumpanddump