Round 1 of The Risk Protocol Trading Competition just got over.
Round 2 just kicked off.
Here is what the competition is about and why you should care.
The instruments: RiskON and RiskOFF
The Risk Protocol splits a single asset (BTC or ETH) into two SMART Tokens:
➡️ RiskON: captures leveraged upside (~2× on moves beyond the strikes). Hold this when you are bullish.
➡️ RiskOFF: caps your downside to 5% per epoch. Hold this when you are bearish.
Every dollar of risk that RiskOFF sheds, RiskON absorbs—and every dollar of upside that RiskON captures comes from what RiskOFF gave up. They are built as counterparties to each other, so at any point in time, the price of RiskON + the price of RiskOFF equals the price of the underlying asset.
The game is knowing when to swap between them.
You do not need to be right every time.
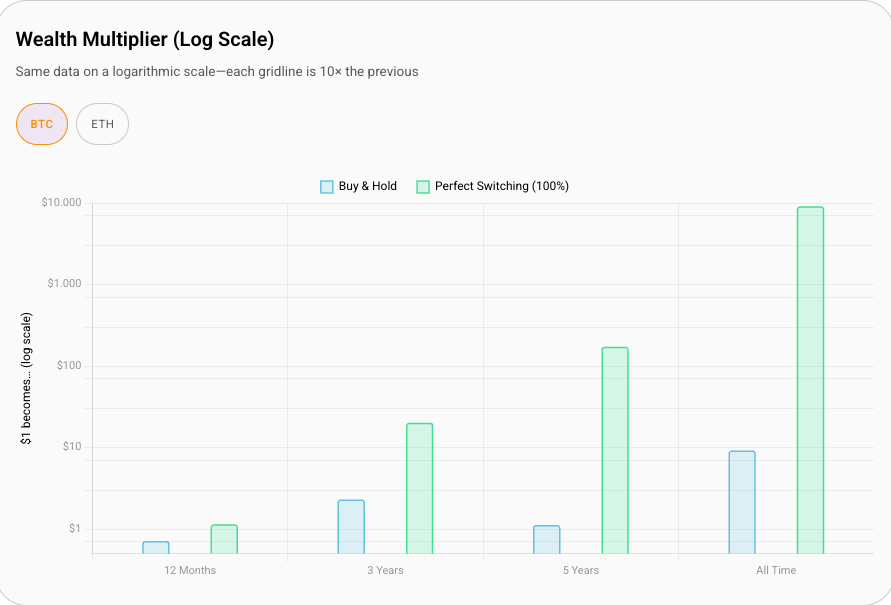
Our research shows that at just 55% accuracy, dynamic switching between RiskON and RiskOFF as market dynamics change begins to beat buy-and-hold. At 66% accuracy over 3 years, BTC traders see +306% median returns versus +132% from just holding.
Full research: https://t.co/U3PxgW4oJy
How you are scored:
Final Score = 60% P&L Score + 40% Risk Awareness Score
Your P&L Score measures how much your portfolio grew. Your Risk Awareness Score measures your Maximum Drawdown—the largest peak-to-trough drop in your portfolio. Lower drawdown means better risk management.
A trader earning 30% returns with only 5% drawdown can outrank someone earning 25% with a 20% drawdown. It is not just about making money; it's also about how well you limit downside risk.
Our Risk Dashboards give you an edge.
Making good swaps starts with reading the market well. Our Risk Dashboards track historic volatility across the top 20 cryptocurrencies—decomposed into upside and downside—so you can see where risk is concentrated. Forecast models predict where volatility is heading. Sortino Ratios across the top 100 cryptocurrencies, broken down by sector and market cap, show you which corners of the market are delivering returns relative to their downside risk. And our Tail Risk dashboard quantifies the probability and severity of extreme losses, so you know when to stay aggressive and when to pull back.
Use them to time your RiskON ↔ RiskOFF swaps with conviction, not guesswork: https://t.co/twPWrAms17
To qualify for Round 2
➡️ $10,000 net volume per round. You can claim free $10,000 of Test BTC and ETH each round to get started
➡️ Active on at least 3 separate days during the round
➡️ Each round runs for 30 days
Two leaderboards. Two ways to win.
Trading Leaderboard: Top 100 traders per round earn RISK Points based on their ranking. Rank 1 earns the most, and points decrease as you move down the leaderboard.
Risk Championship: Tracks cumulative performance across all rounds. One great round is not enough. Consistency is key. Top 10 earn additional RISK Points.
Missed Round 1? Jump in now and start earning.
Did well in Round 1? Do not stop. The Risk Championship rewards consistency across rounds.
May the best trader win Round 2.
https://t.co/Q5bt70v9Ka
Great breakdown from @evans1vn.
This is our thesis behind turning 'Risk' from something you fear to something you exploit for Alpha: being right on market direction just 55% of the time is enough to start to beat buy-and-hold, as RiskON gives you ~2× leveraged upside without funding rates or margin calls, while RiskOFF caps your downside at 5%.
Modest skill, compounded.
I want to put my community onto a protocol i have been watching closely @TheRiskProtocol.
Their mission is to tokenize risk itself, somewhat similar to how Pendle tokenized yield.
Crypto built world class rails for trading and payments but stayed underdeveloped on the one pillar that defines real finance risk.
TRP is built to close that gap and bring institutional grade risk management to crypto.
Most of DeFi gives you two speeds: full risk on or park in stables.
TRP collapses that into one clean decision.
TRP SMART Token Mechanism takes a single asset like BTC or ETH and splits it into separate tradable risk profiles:
→ RiskON for when you expect the market to rally. Roughly 2× leverage on the move with no margin calls or funding rates.
→ RiskOFF for when you expect a drawdown. Downside capped at 5% per epoch while retaining meaningful upside
Hold RiskON when you are bullish. Rotate into RiskOFF when you turn cautious.
That is the entire game. And RiskON and RiskOFF are just the beginning a whole slew of new SMART Tokens is still to come.
What actually caught my attention was the research they put out.
They ran simulations across BTC and ETH and found something wild: just by dynamically switching between RiskON and RiskOFF as your outlook shifts you do not need to be a savant to beat buy and hold.
The break even point sits at roughly 55% accuracy.
Be right just slightly more often than a coin flip and the switching starts to win.
At 66% accuracy on BTC over three years the median outcome came in at +306% more than double the +132% from buy and hold.
The comprehensive research is here → https://t.co/3PfBRp8l4W
That reframed the whole thing for me. We have had yield we have had perps, we have had LPing.
This feels like DeFi just added one more fundamentally better way to generate Alpha not by piling on more leverage but by letting you express a simple view on risk and get paid for being right a little more than half the time.
Week 13 of Weekly RiskFi Insights is live: Risk Alpha ⍺
💰 $100 to the sharpest entry
On The Risk Protocol, BTC and ETH can be split into SMART Tokens: RiskON gives you ~2x leveraged upside with no margin calls or funding rates. RiskOFF caps your loss at 5% while retaining meaningful upside. Hold RiskON when bullish, rotate into RiskOFF when you sense trouble, and that switching becomes the edge.
Our research shows the bar is lower than you might think: get the switching call right about 55% of the time, and you already beat buy-and-hold; at 66%, BTC returned a median of 306% vs +132% for buy-and-hold.
That is Risk Alpha: https://t.co/U3PxgW4oJy
So here is what you need to do:
1️⃣ Find your edge anywhere. The charts you already stare at all day, the on-chain dashboards, our own risk dashboards (https://t.co/twPWrAms17), or your own models. We do not care where your insight comes from.
2️⃣ Switch between RiskON and RiskOFF at https://t.co/Q5bt70v9Ka.
3️⃣ You get $10,000 of test BTC and ETH as part of our ongoing Trading Competition on Incentivized Testnet. So, you can earn Risk Points in addition to $100.
4️⃣ Post screenshots of the data you read and the trades you made, then walk us through why you switched, and how it turned out.
The sharpest reasoning, backed by real trades, wins.
🏆 Quote tweet this with your post and tag @TheRiskProtocol
⏰ Closes Wednesday, June 3, 23:59 UTC
Everyone on CT has an opinion about size.
"Large caps are the play"
"Nah,small cap season is loading"
I checked the actual data and both of them are wrong rn.
RiskFi Memes & Insights | @TheRiskProtocol
Winner of Week 12 of the RiskFi Memes & Insights Competition 🥇
Congratulations to @Ajetcrypt. The winning entry is in the replies.
Here is what set it apart: instead of a single observation, it delivered an actual asset allocation pulled straight from the dashboards. Top-20 caps down -1.7%. The "small cap season" cohort down -2.8%. But the 21st–40th cohort? Up +6.7% over 30D with a 0.53 Sharpe. Not just "be careful" or "risk is elevated"—a precise read on exactly where the alpha is hiding, and where it isn't.
That's the standard this whole season was built to reward.
And with that, Season 2 comes to a close.
Weeks of memes that actually carried a signal. A community that learned to read volatility regimes, VaR histograms, correlation heatmaps, and vol spreads—and turn them into insights worth screenshotting.
This isn't the end. Season 3 kicks off soon—same $100 USDC weekly prize, and a few new twists worth sticking around for.
Stay tuned 👀
Risk Memes and Insights
@TheRiskProtocol
The market is quietly rotating.
BTC looks calm, ETH looks unstable. Most traders see nothing happening.
That’s the mistake.
What the data actually shows is a volatility transfer regime and ETH is becoming the market’s steering wheel.
RiskFi Memes & Insights, Week 12 is LIVE.
Last week's winner is in the replies. Here's why @gen2glitter took it:
While most traders saw a calm BTC and a shaky ETH and assumed nothing was happening, this entry caught the rotation underneath. The Volatility Regime Heatmap showed BTC realized volatility sitting low, while ETH realized volatility read very high, but forecast volatility very low—the market is expecting ETH to cool off. The entry then cross-checked against the VaR histograms: ETH's worst days run deeper than BTC's, with fatter tails. One chart spotted the signal, the other confirmed it. That's a volatility transfer regime, read straight off the dashboards.
Reading multiple charts to form a thesis. That's the bar.
Your turn:
Screenshot something real from our Risk Dashboards → https://t.co/twPWrAms17
Meme it. Caption it. Remix it. Whatever makes the point land.
Quote Tweet this post, mention RiskFi Memes & Insights, and tag @TheRiskProtocol
Drop the dashboard link in your post or a reply
The meme has to stand on its own. You can describe it if you want, but if someone scrolls past the words, the image alone should still hit.
The four things we score on:
🎯 Insight: real signal under the joke
😂 Funny: actually funny, not a template with a screenshot stapled on
🚀 Viral: the kind of thing CT screenshots
⚔️ Challenge: extra credit for taking on a KOL or media claim with hard data
Additional Bonus: Drop your TRP app referral link in your submission.
⏰ Deadline: Monday, May 25 at 23:59 UTC
💰 $100 USDC
🏆 Winner announced May 27
First, let’s look at Volatility Over Time (7D/30D on BTC).
Total volatility (blue line) remains elevated.
Downside volatility (red) has been much more aggressive than upside (green).
Price is trying to recover, but the risk isn’t calming down with it.
RiskFi Memes & Insights Competition—Week 11 is LIVE ⏯️
Chart. Punchline. Repeat.
Last week's winner is in the replies. Here's why @Abimzz_X took it:
He went somewhere almost no one else does—the vol spread chart. While most entries fixate on price, he zoomed in on the gap between upside and downside vol and pulled out a real tradeable principle: when downside vol dominates upside vol, your position sizing should reflect the actual risk profile, not the price move.
That's the bar. Pull a real signal from the dashboards. Make it funny. Make it land.
Your turn:
Screenshot a signal on our Risk Dashboards → https://t.co/twPWrAms17
Meme it. Caption it. Remix it. Whatever makes the point land
Quote Tweet this post, mention RiskFi Memes & Insights, and tag @TheRiskProtocol
Drop the dashboard link in your post or a reply
The meme has to stand on its own. You can describe it if you want, but if someone scrolls past the words, the image alone should still hit.
The four things we score on:
🎯 Insight—real signal under the joke
😂 Funny—actually funny, not a template with a screenshot stapled on
🚀 Viral—the kind of thing CT screenshots
⚔️ Challenge—bonus for taking on a KOL or media claim with hard data
Additional Bonus: Drop your TRP app referral link in your submission.
⏰ Deadline: Monday, May 18 at 23:59 UTC
💰 $100 USDC
🏆 Winner announced May 20
6 days left in Round 1 of @TheRiskProtocol Incentivized Testnet Trading Competition.
Top 100 traders earn RISK points.
To qualify:
→ Be active on at least 3 trading days
→ $10,000+ total transaction volume
Still time to make the leaderboard.
RiskON x RiskOFF: Turning Risk Into Alpha with @TheRiskProtocol
Most traders think you need near-perfect timing to beat buy-and-hold. But maybe that's not the real game.
What matters more is having a small edge and the right instrument to express it. That is why the ~55% number is interesting.
Before getting to the math, the instrument itself is worth understanding. The Risk Protocol's SMART Tokens take a single asset like BTC or ETH and split it into two complementary halves: RiskON and RiskOFF. Each starts at 50% of the underlying's value, and together they always equal the whole. But their risk profiles are radically different, one is built for the upside, the other for the downside.
That structure is what makes "dynamic switching" possible. You hold one at a time depending on your directional view, and switching between them is a single swap on TRP's Risk Marketplace. Bullish? Hold RiskON. Bearish? Rotate to RiskOFF.
Dynamic switching between RiskON and RiskOFF suggests you only need around 55%–56% accuracy to beat BTC and ETH buy-and-hold across multiple timeframes.
Not 80%. Not 90%. Just slightly better than a coin flip.
----------
① RiskON = Upside Expression
RiskON is the offensive side of the structure.
When you are bullish, it gives you amplified upside if the market moves beyond the defined range (~8%), without the usual liquidation risk, margin calls, or funding costs of traditional leverage.
So instead of simply holding spot, you are expressing an upside view through a structured risk position.
----------
② RiskOFF = Defensive Expression
RiskOFF is the defensive side of the structure.
When you want to reduce exposure in a bearish regime, RiskOFF is designed to cap downside at 5% per epoch.
Instead of holding spot through every drawdown, traders can rotate into a more defensive profile of the same underlying asset.
In other words, risk control is no longer just a defensive move. It becomes an active position.
----------
③ Dynamic Switching = Alpha Engine
Each epoch lasts 30 days. You do not need to predict every candle. You only need to read the broader market regime slightly better than random.
That is where the backtest gets interesting:
For BTC:
→ 66% accuracy over 3Y: +306% median return
→ BTC buy-and-hold over the same period: +132%
For ETH:
→ 66% accuracy over 3Y: +148% median return
→ ETH buy-and-hold over the same period: +14%
The real takeaway is not perfect prediction, but the power of combining a small edge with a convex payoff structure.
----------
④ RiskFi = Risk as Alpha
Most of DeFi still treats risk as something to avoid, hedge, or insure. But RiskON/RiskOFF frames it differently:
→ Risk can be split
→ Risk can be priced
→ Risk can be traded
And when traders can move between different risk profiles of the same asset, risk itself can become a source of alpha.
That is what makes The Risk Protocol interesting to me. It is not just another leverage or yield product. It is a primitive for expressing market regime views through structured risk.
----------
Risk is no longer just something to hedge. It becomes something to trade.
➥ Small edge + convex instrument = RiskFi alpha.
📖 The full study, with the simulation methodology: https://t.co/onIypKLlRz
VaR says: “you’ll probably lose -3.8%, you’re fine”
Expected Shortfall says: “worst case is -5.24%, rare tho”
Meanwhile me: always in the “rare” part 😭
99% of my trades ends up in the 5% tail 💀🥲
RiskFi Memes & Insights | @TheRiskProtocol
RiskFi Memes & Insights Competition—Week 10 is LIVE
Last week's winner is in the replies. Here's why @heis_Aiden took it:
Most traders look at VaR and think, "I can only lose -3.80%, I like those odds." But VaR only tells you the boundary. When that 5% tail event hits, the Expected Shortfall indicates an average loss of -5.24%, and the histogram's left tail visually shows how far it goes. The meme nailed the distinction between VaR and CVaR—and landed a tradeable takeaway: size your positions for the Expected Shortfall, not the VaR.
That's the bar. Pull a real signal from the dashboards. Make it funny. Make it land.
How to enter:
1. Pull a real screenshot from our Risk Dashboards → https://t.co/twPWrAms17
2. Turn it into a meme—caption it, remix it, collage it, go wild
3. Quote Tweet this post, mention RiskFi Memes & Insights, and tag @TheRiskProtocol
4. Link the specific dashboard you used in your post or a reply
You're encouraged to describe your meme in your post or comment, but the meme should stand on its own.
What we're looking for:
🎯 A unique, practical trading insight—real signal under the joke
😂 Genuinely funny, not a template with data pasted on
🚀 Virality potential—the kind of thing people screenshot and share
Bonus: Tag a crypto media outlet or KOL and use the dashboard to confirm or challenge a claim from their recent article or post.
Extra Bonus: Drop your TRP app referral link in your submission.
⏰ Deadline: Monday, May 11 at 23:59 UTC
💰 $100 USDC
🏆 Winner announced May 13
Prefer Telegram over Discord? We have got you covered.
The Risk Protocol's official Telegram channel is live—updates, research, and alerts delivered straight to your chat.
Join us → https://t.co/mkMcvkLFgu
RiskFi Memes & Insights Competition—Week 9 is LIVE
Last week's winner's Tweet is in the replies. Here is why @The_emperor036 took it:
The narrative around DePIN and gaming made them look like a perfect dip buy on price alone. But the dashboard showed downside volatility dominating upside volatility, with a negative Sharpe Ratio, meaning it wasn't a dip; it was a falling knife. The meme landed the point in a way no paragraph of analysis could.
Bonus: he tagged two other crypto orgs to challenge their DePIN narratives directly.
That's the bar: Pull a real signal from the dashboards. Make it funny. Make it land.
How to enter:
1. Pull a screenshot from our Risk Dashboards → https://t.co/twPWrAms17
2. Turn it into a meme—caption it, remix it, collage it, go wild
3. Quote Tweet this post, mention RiskFi Memes & Insights, and tag @TheRiskProtocol
4. Link the specific dashboard you used in your post or a reply
You are encouraged to describe your meme in your post or comment, but the meme should stand on its own.
What we're looking for:
🎯 A unique, practical trading insight
😂 Genuinely funny, not a template with data pasted on
🚀 Virality potential—the kind of thing people screenshot and share
Bonus: Tag a crypto media outlet or KOL and use the dashboard to confirm or challenge a claim from their recent article or post.
Extra Bonus: Drop your TRP app referral link in your submission.
⏰ Deadline: Monday, May 4 at 23:59 UTC
💰 $100 USDC
🏆 Winner announced May 6
Two questions every trader asks:
"How right do I need to be to beat buy-and-hold?"
"How wrong can I be and still win?"
@TheRiskProtocol ran 10,000 Monte Carlo simulations across real BTC and ETH price data. The answer to both: 55% accuracy is the threshold where dynamic switching starts winning.
Barely above a coin flip.
Here is why the math works. The Risk Protocol's SMART Tokens take a single asset and split it into two complementary tokens - RiskON (the leveraged half) and RiskOFF (the protected half). You always hold one or the other based on your directional view, and switching between them is a single swap.
That is what "dynamic switching" means in practice- toggling between two halves of the same asset as the regime changes:
> RiskON captures approximately 2x leveraged upside when the market moves your way
> RiskOFF caps your maximum loss at 5% per epoch when it does not, while retaining meaningful upside
A correct bull call amplifies your gain. A correct bear call limits your damage to 5% that epoch. The payoff curve bends in your favour even at modest accuracy.
At 66% accuracy over three years, a BTC trader running this strategy returned a median of +306% versus +132% from buy-and-hold.
Here is the full study: https://t.co/uRQ1DRfuui
The Risk Protocol's Incentivised Testnet is live right now.
You can apply exactly what this article teaches to their ongoing Trading Competition and earn Protocol Points → https://t.co/djMa1bAoUr
You only need to be right 55% of the time to outperform buy-and-hold on $BTC. that's the number that stopped me.
I've just gone through the new piece of research from @TheRiskProtocol and this gives me a new look at how our trade strategy is more important than just holding long-term conviction.
They ran 10,000 Monte Carlo simulations for the #RiskFi backtest and proved: the edge to outperform is in having an instrument that punishes being wrong less than it rewards being right.
when you're wrong and holding RiskOFF, you lose 5% max.
when you're right and holding RiskON, you get ~2× on the upside without liquidation.
over 3 years at 66% accuracy, that compounds to +306% on BTC. buy-and-hold returned +132% in the same period.
A pretty good read from @TheRiskProtocol, learn it here:
https://t.co/gClt2WVICj
We are hosting an AMA on Discord tomorrow, 30th April, 12 PM UTC.
Bring every question you have about the Testnet Trading Competition and the broader Points Program. We will try to answer all of them.
Round 1 kicked off on 17th April. Each round runs 30 days, so you can still enter in the 1st Round itself, and there are more rounds coming.
Join our Discord: https://t.co/2fe8xUQRBV