$DXY / #US.DOLLAR | 1H Trade Setup Update
Position: 🟢 Long
Trade Details:
Entry: $114,421
Stop Loss: $112,648
Take Profit: $115,681
● Current Analysis:
DXY has entered a potential short trade zone. The price is currently at $114,844 signs of weakening bullish momentum. Key indicator, Bearish Divergence, is observed across multiple time frames (4h, 1h, 24m, 12m, 6m), suggesting that the recent upward move may be losing steam, with a potential reversal toward lower liquidity zones.
● Technical Indicators:
Momentum: Bullish Divergence with a 2.25% decrease over the last period supports the short setup, hinting at overbought conditions ripe for a downward correction.
Volume Profile: Not directly visible, but price action implies significant liquidity below current levels, increasing the probability of a downward move.
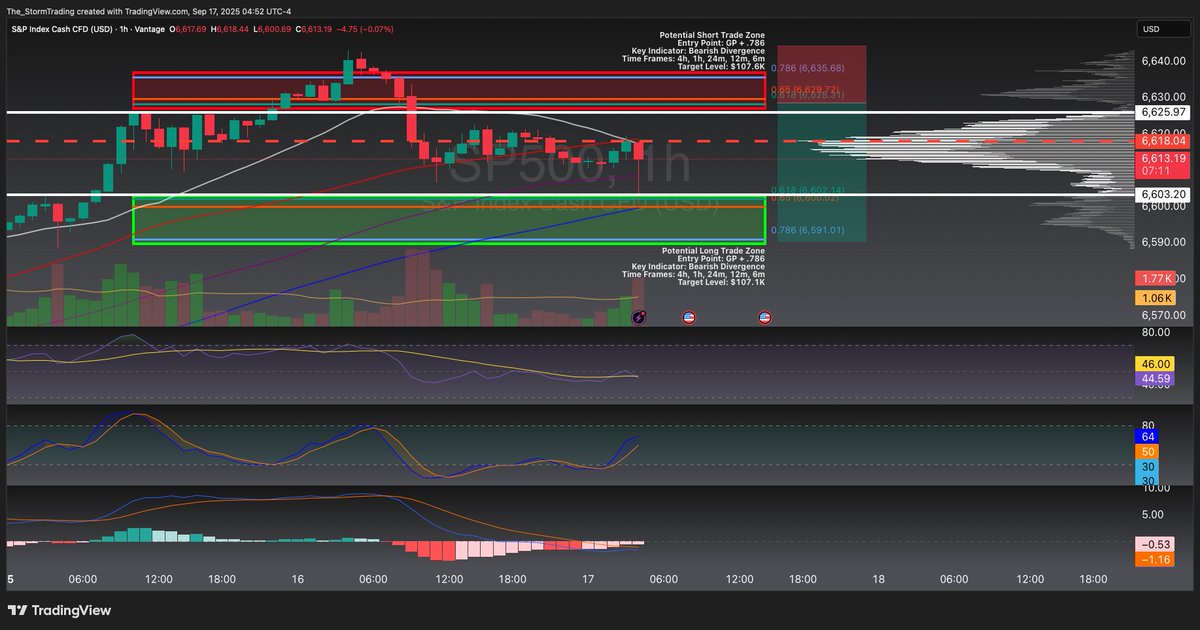
$SP500 / #SP500 | 1H Trade Setup Update
Position: 🔴 Short
Trade Details:
Entry: $114,421
Stop Loss: $112,648
Take Profit: $115,681
● Current Analysis:
S&P500 has entered a potential short trade zone. The price is currently at $114,844 signs of weakening bullish momentum. Key indicator, Bearish Divergence, is observed across multiple time frames (4h, 1h, 24m, 12m, 6m), suggesting that the recent upward move may be losing steam, with a potential reversal toward lower liquidity zones.
● Technical Indicators:
Momentum: Bearish Divergence with a 2.25% decrease over the last period supports the short setup, hinting at overbought conditions ripe for a downward correction.
Volume Profile: Not directly visible, but price action implies significant liquidity below current levels, increasing the probability of a downward move.
Good morning, everyone.
As we start the day, let's conduct a thorough market analysis to pinpoint key opportunities. Maintain focus and discipline as we aim for a successful trading day ahead.
The #Dow Jones, the #S&P 500, the #Nasdaq-100, and the #Russell 2000 are all trading above their respective 21-day EMAs.
Their 21-day EMAs have a rising slope.
Their 21-day EMAs are above their 55-day EMAs.
Their 55-day EMAs have a rising slope.
Their 55-day EMAs are above their 200-day EMAs.
Their 200-day EMAs also have a rising slope.
That's called an uptrend.
Every major U.S. stock market index is in an uptrend.
It's your job as an investor to recognize these basic facts and objective truths, and then make a decision about whether or not you want to align with those uptrends, or fight them.
#Bitcoin $BTC Has been mostly green on Tuesday's and Wednesday's the past month.
Pretty much every other day has been red with Sunday pretty flat.
Overall, very slow period in terms of Bitcoin price action. There's some up and down movements but price essentially at the same region for the past 4 months.
Types of Orders During Trading 📚
One aspect I can recommend every trader to include in their trade journals is the type of buy & sell orders you use.
Do you always set limit orders? Or simply market buy & sell everything? Maybe you use TWAP orders or scale in and out using dozens of orders.
If you got a nice sample size on your trading results, you will find that one or the other generally makes you a lot more money depending on your trading style.
Personally, I find that when I market order in/out, it means I'm generally impatient and could have gotten a better entry or exit the majority of the time. Key to also note what happens after you do what you do, so you can accurately track if a certain action was indeed the correct one.
When market orders do work for me are when the I react to news quickly and need to get my buys or sells in fast. When speed is of the essence, limit orders generally won't cut it.
Also good to note the big difference in fees between limit & market orders which will definitely have a longer term impact on your final PnL result.
Good morning, everyone.
As we start the day, let's conduct a thorough market analysis to pinpoint key opportunities. Maintain focus and discipline as we aim for a successful trading day ahead.
The past three years haven't shown a correction in September.
The correction took place in August.
In August, #Bitcoin corrected by nearly 10%.
Yes, we could have a deeper correction and yes, I'm heavily buying that one, but the closer we get to the FED meeting, the less of a chance I'd give the correction to continue, especially if $BTC breaks through $112k.
#Bitcoin $BTC Liquidation Heatmap is telling a clear story. Market has been undecisive and positions are building up.
The longer price consolidates here, the larger the move out of this price range will be.
The major area's to watch in the short term are:
$107K & $114K.
Good morning, everyone.
As we start the day, let's conduct a thorough market analysis to pinpoint key opportunities. Maintain focus and discipline as we aim for a successful trading day ahead.
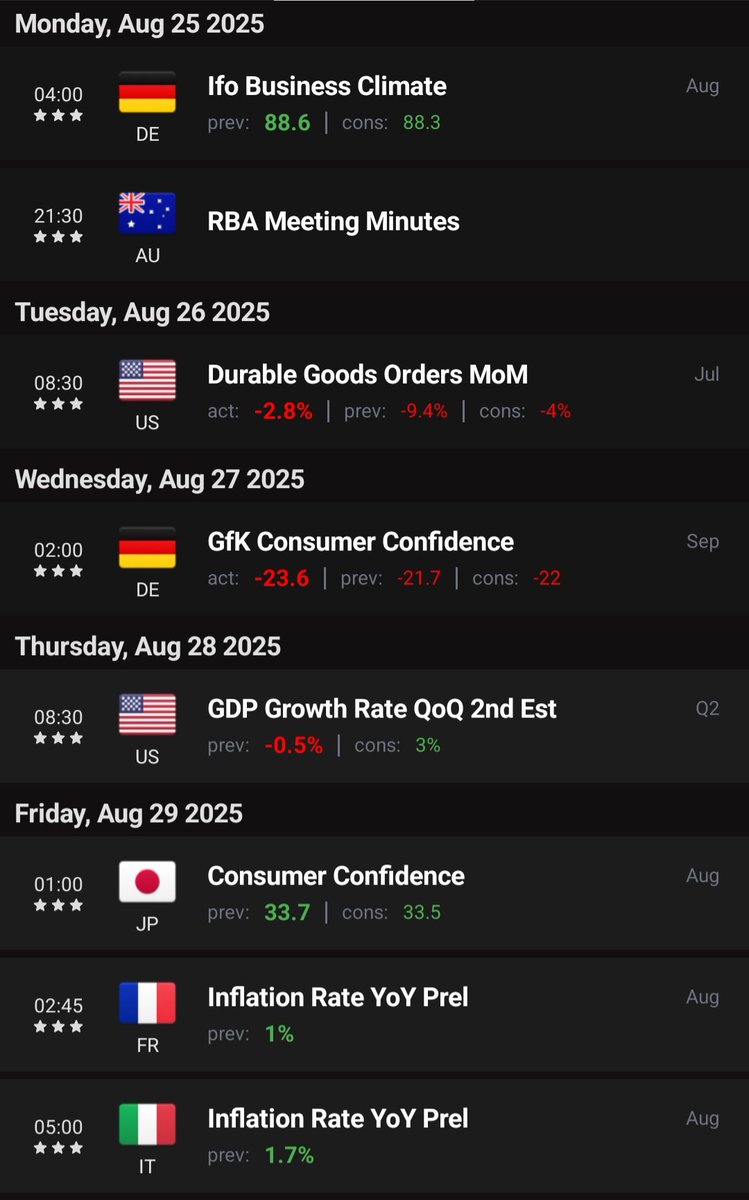
With this week's economic data—DE GfK Consumer Confidence (act: -23.6, prev: -21.7) today, US Durable Goods Orders (act: -2.8%, prev: -9.4%) on Tuesday, US GDP Growth Rate Q2 2nd Est (prev: -0.5%, cons: 3%) on Thursday, and JP Consumer Confidence plus FR and IT Inflation Rate YoY Prel on Friday—markets may stay choppy.
Weak DE sentiment and US orders signal caution, but a potential GDP beat could boost risk appetite. Watch for volatility!
#Bitcoin $BTC First took out the liquidity at ~$120K (Range High) and then proceeded to take ut the big cluster at ~$110K (Range Low).
There's still a decent cluster left at ~$107K and there's more building up around the "Powell candle" at ~$117K so those are the two levels to watch in the short term.
I think that $117K level is also the key area to flip this local trend back around and make room for a move to the highs.
Until then I expect the market to remain choppy and it's not a market I want to actively trade in. Especially seeing the weakness on most alts.
$ETH & $BTC Important area's.
Different timeframes but same setup. Broke down during this weekend/monday flush, now attempting to get back into their respective ranges.
If they do, that's a good setup for further relief. But key area's here on both.