How to use Fibonacci to identify potential price targets when a stock is in price discovery.
If you found this video helpful give it a like, repost or drop a comment below.
$IONQ $APP $RGTI
$PLTR - the current resistance is the 4.618 fib level of the entire chart going back to 2021. If it tumbles, $130 is in the cards. It's the 9ema on the monthly, .5 fib level of this entire leg, and near 200ma on the daily. And, yes, there's room to go lower. $220 above.
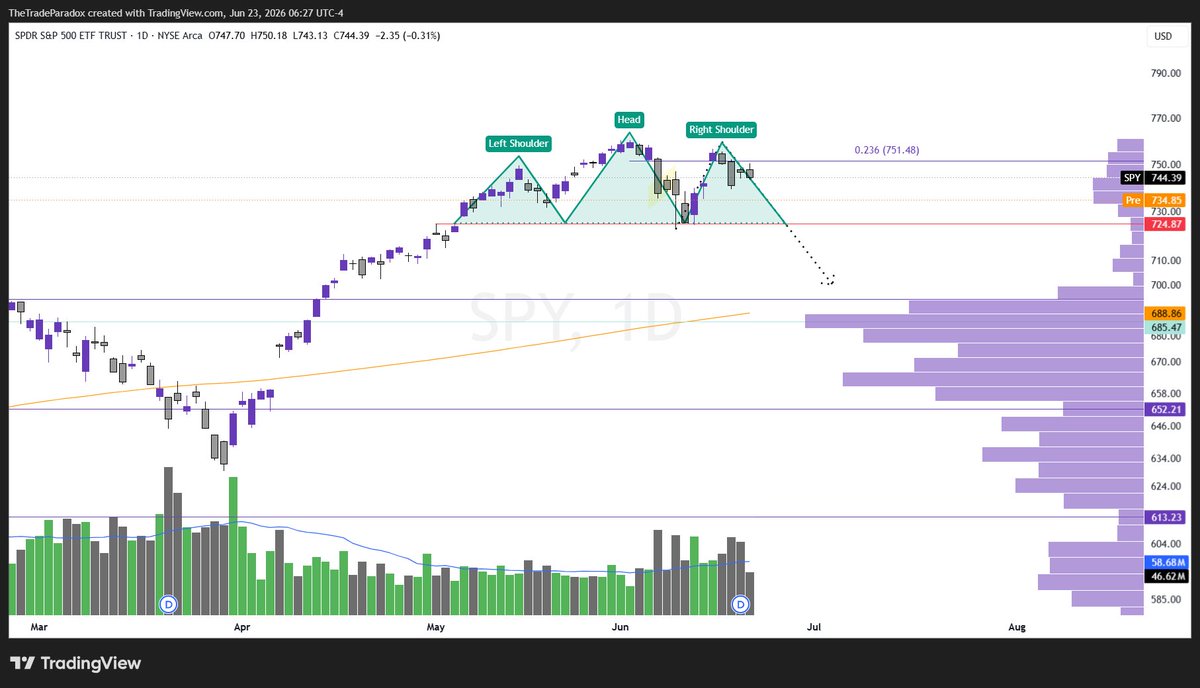
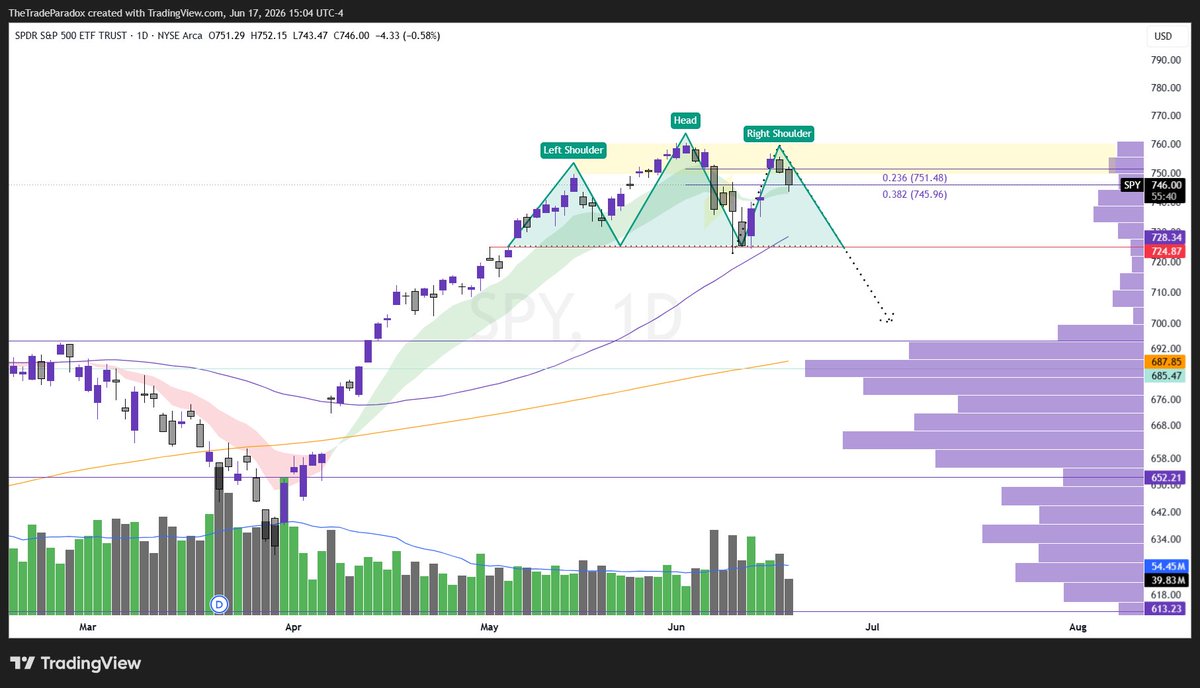
$SPY got the sharp bounced mentioned in another post, slightly higher than anticipated, but no new highs. Possible head and shoulders forming.
Losing 9/21EMA cloud strengthens the case for $700.
$TSLA is getting tighter within this rising wedge.
See the purple line? Monthly 50MA at $282. The blue line is the 2019 avwap low tested in 2023 and 2024. It's currently sitting at $193.
$TSLA No, I'm not bearish. I'm observing. Coming up on ATH resistance at 488.54. A breakout will target 600 first on the longer time frame. A rejection of all time high can push back to 350-360. Absurd. Quite possibly. Last time Tesla had a similar pattern, it broke down, then soared. It was just an electric car company then.
$SPX
Remember this chart.
Since 2020, $SPX tested the 50 moving average (monthly) leading to well over 20% correction and running approximately 2,600 points.
We've just hit that wall.
$KTOS long-term investment in defense.
-Market cap: $12.85B
-Revenue TTM: 1.28B (14% YoY)
-Negative FCF due to heavy investment in drone programs, unmanned systems, hypersonic & tech space tech.
-P/E elevated due to thin & volatile earnings, market pricing in future growth
$SPY got the sharp bounced mentioned in another post, slightly higher than anticipated, but no new highs. Possible head and shoulders forming.
Losing 9/21EMA cloud strengthens the case for $700.
$SPY got the sharp bounced mentioned in another post, slightly higher than anticipated, but no new highs. Possible head and shoulders forming.
Losing 9/21EMA cloud strengthens the case for $700.
$SPY I've shared my $SPX chart which shows a correction pattern over the last 5 years.
The $SPY $724 call out yesterday was spot on at the 50EMA. I think we'll get a test of $700-$715.
It is possible this is part of a larger correction. Let's see if the 50 EMA / SMA hold.
@TrendSpider I went bearish on $MSFT last year. It was a bit too obvious. If it loses the monthly 50MA, there will be significantly more pain. https://t.co/I5cXRIuGGL
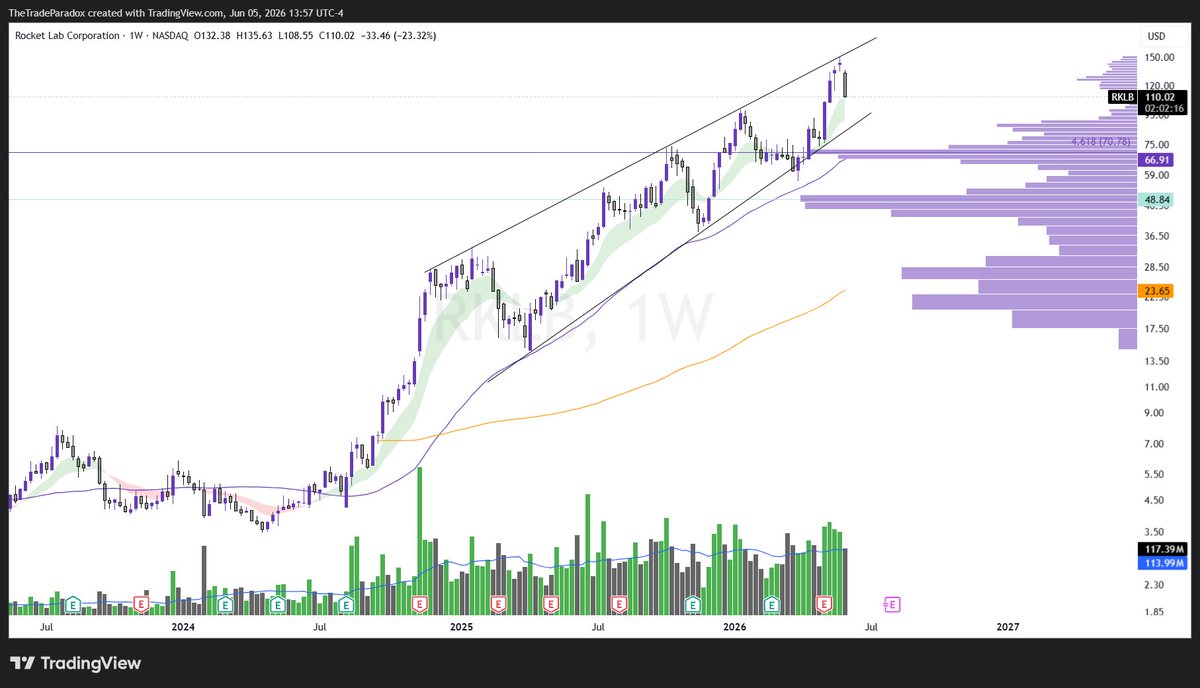
$RKLB is now at $110. I exited my puts two days ago for 130% gains. Weekly shows there's a chance for a bounce here, but the daily is calling for sub $100.