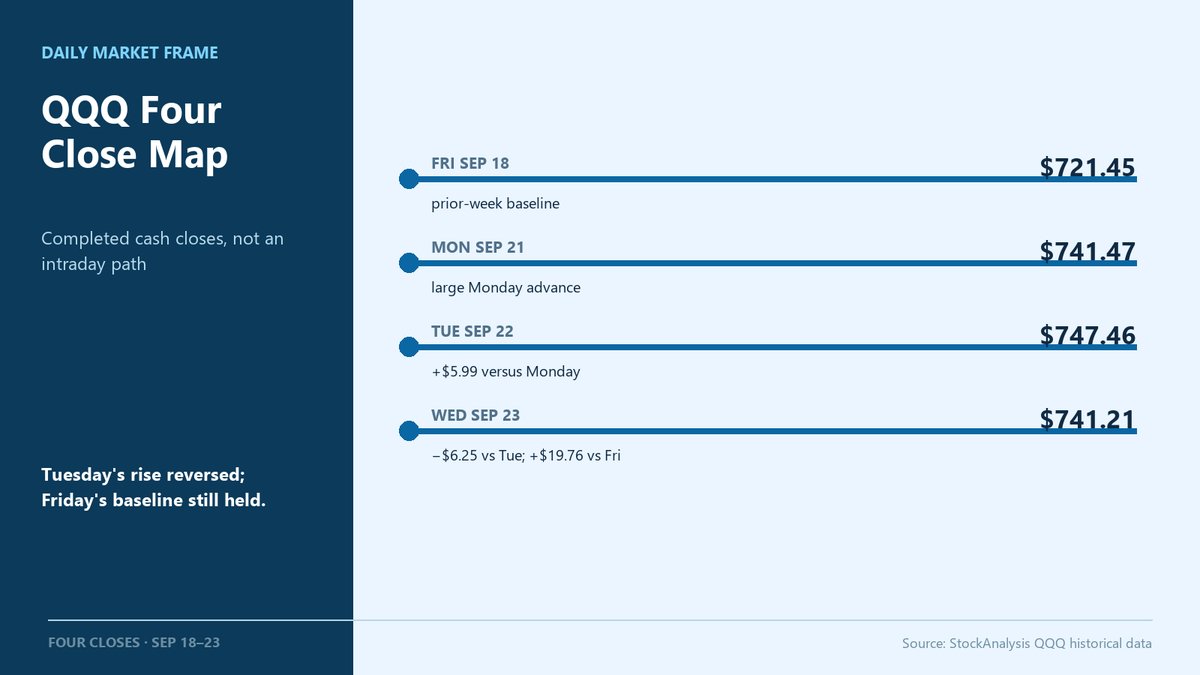
$QQQ erased Tuesday's gain on Wednesday, but not Monday's. It closed at $741.21, $6.25 below Tuesday's $747.46 and 26 cents below Monday's $741.47. Tuesday had added $5.99, so that one-day advance was fully retraced.
Friday's close was $721.45. Wednesday remained $19.76 above it, even after the drop. Saying “the week's gains vanished” would hide the larger Monday move that is still in the closing-price comparison.
The useful map has two different tests: $747.46 is the completed close from before the reversal; $721.45 is the prior-week baseline. A new completed close can show whether the reversal extends. A premarket quote alone cannot settle that multi-day question. #Nasdaq
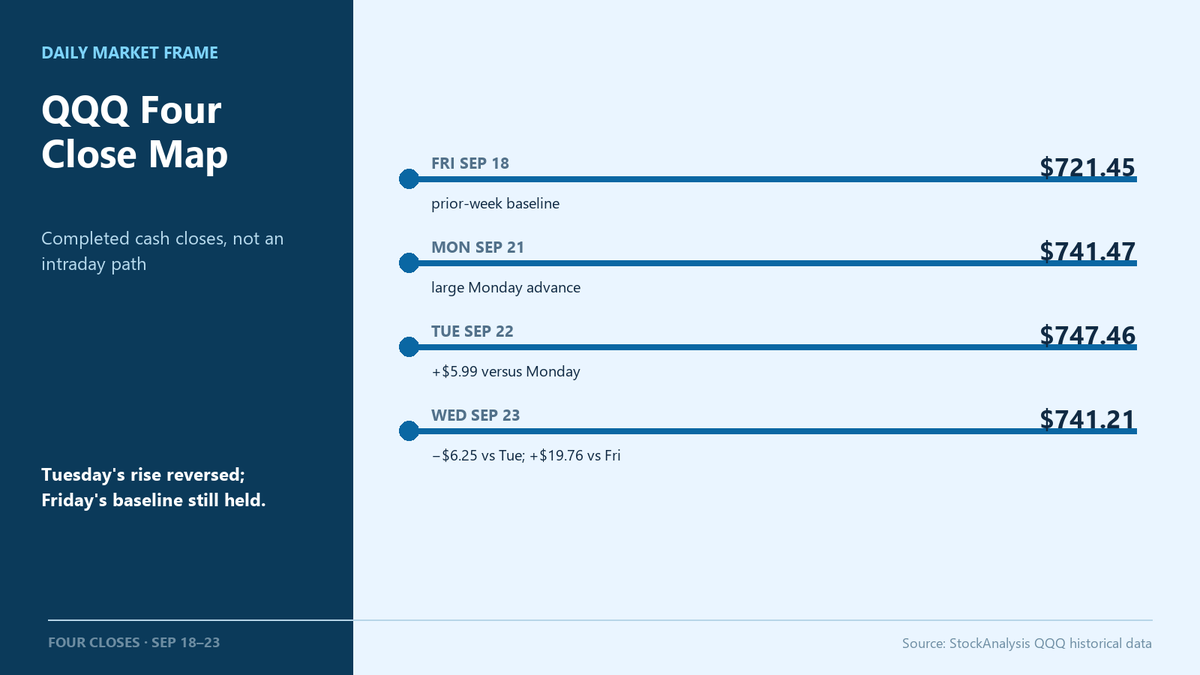
$QQQ erased Tuesday's gain on Wednesday, but not Monday's. It closed at $741.21, $6.25 below Tuesday's $747.46 and 26 cents below Monday's $741.47. Tuesday had added $5.99, so that one-day advance was fully retraced.
Friday's close was $721.45. Wednesday remained $19.76 above it, even after the drop. Saying “the week's gains vanished” would hide the larger Monday move that is still in the closing-price comparison.
The useful map has two different tests: $747.46 is the completed close from before the reversal; $721.45 is the prior-week baseline. A new completed close can show whether the reversal extends. A premarket quote alone cannot settle that multi-day question. #Nasdaq
@NoLimitGains If negative beta is this widespread, the index becomes a weaker signal for what the average stock is doing. That's where @Thelevelsdaily's index and sector levels can help put the divergence in context.
$SPY closed Tuesday at $773.38 and opened Wednesday at $772.79. At 11:12 a.m. ET it was $769.61, inside a reported $768.37–$773.02 session range.
The prior close sat above the top of that observed range. That describes where the market had traded by the snapshot, not when the low occurred or whether a rebound is underway. A later move through the opening reference would change this map; the unfinished session can still extend the range. #MarketStructure
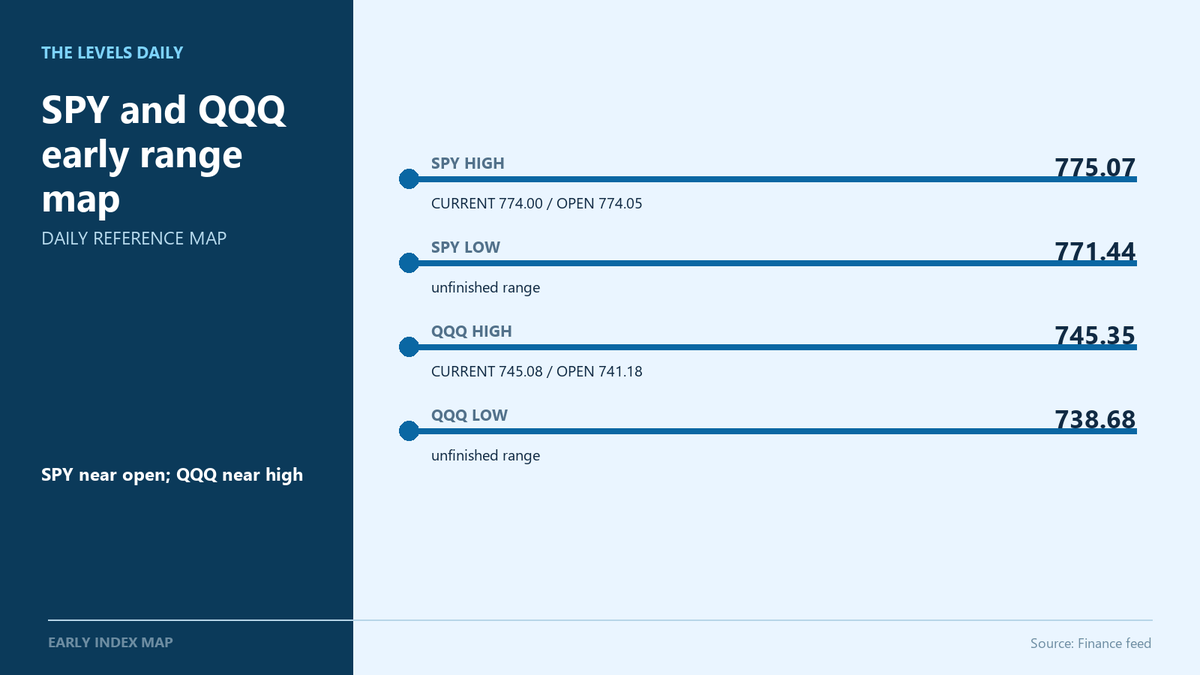
SPY sat near its open while QQQ held near the top of its early range. #MarketLevels
SPY: 774.05 open, 771.44 low, 775.07 high, 774.00 at 9:55 a.m. ET.
QQQ: 741.18 open, 738.68 low, 745.35 high, 745.08 current.
These are locations inside an unfinished range, not a reconstructed path. The useful contrast is position: SPY near the open, QQQ near the high. Later prices should replace this early map.
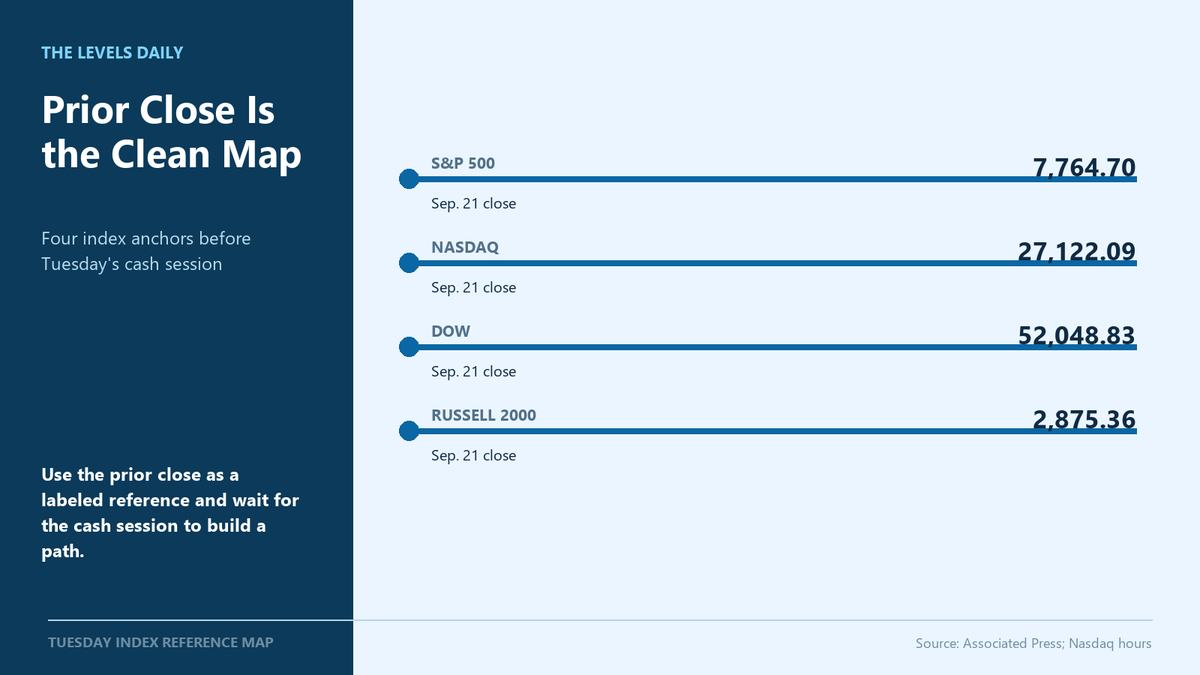
Tuesday's cleanest map starts with Monday's closes: S&P 500 7,764.70; Nasdaq 27,122.09; Dow 52,048.83; Russell 2000 2,875.36. #MarketLevels
Those four numbers are references, not forecasts. They tell us where the last cash session ended; they do not tell us the order of Tuesday's moves. The useful update begins after 9:30 ET: which indexes hold above their prior close, which fall back below it, and whether small caps participate.
Label the clock before labeling the level. A premarket print, the official cash open and the prior close answer different questions.
SPY's first 15-minute range is 766.03–766.85. It was built from the three completed 5-minute bars after the cash open; the 09:40 bar closed at 766.85, the upper edge, after a 761.54 prior close.
That tells us the gap held through the first box; it does not yet prove acceptance above it. A single 09:45 print above 766.85 is not enough. Completed bars outside the box matter more than one updating quote.
The map now has three states: sustained trade above 766.85 confirms expansion, trade back inside keeps the gap unresolved, and a move below 766.03 marks a failed opening range. Those are review conditions, not buy or sell instructions.
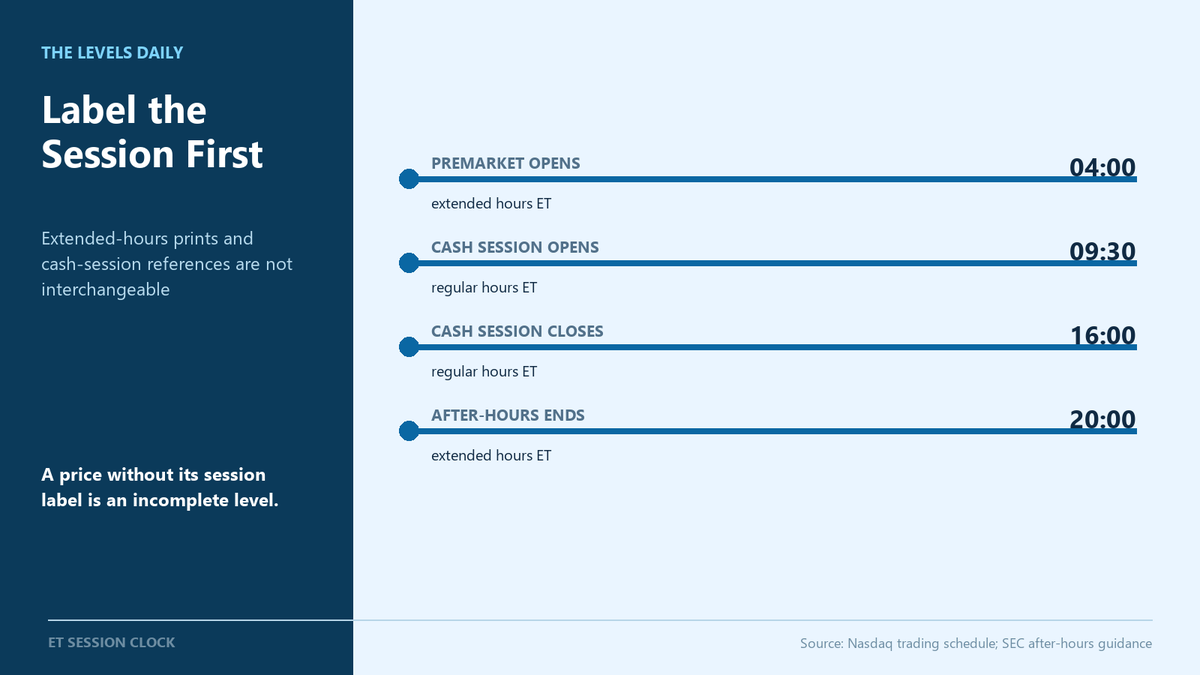
Three clocks belong on every level map: an extended-hours print, the 9:30 cash open, and the 4:00 close. Nasdaq lists premarket from 4:00 to 9:30 and regular hours from 9:30 to 4:00 ET. They are not interchangeable.
A premarket high can be useful context, but thinner liquidity and wider spreads make it a different reference from the opening auction or the regular-session range. Label the session before drawing meaning from the number.
That is why a level map should say where every reference came from. A price without its session is not a complete level.
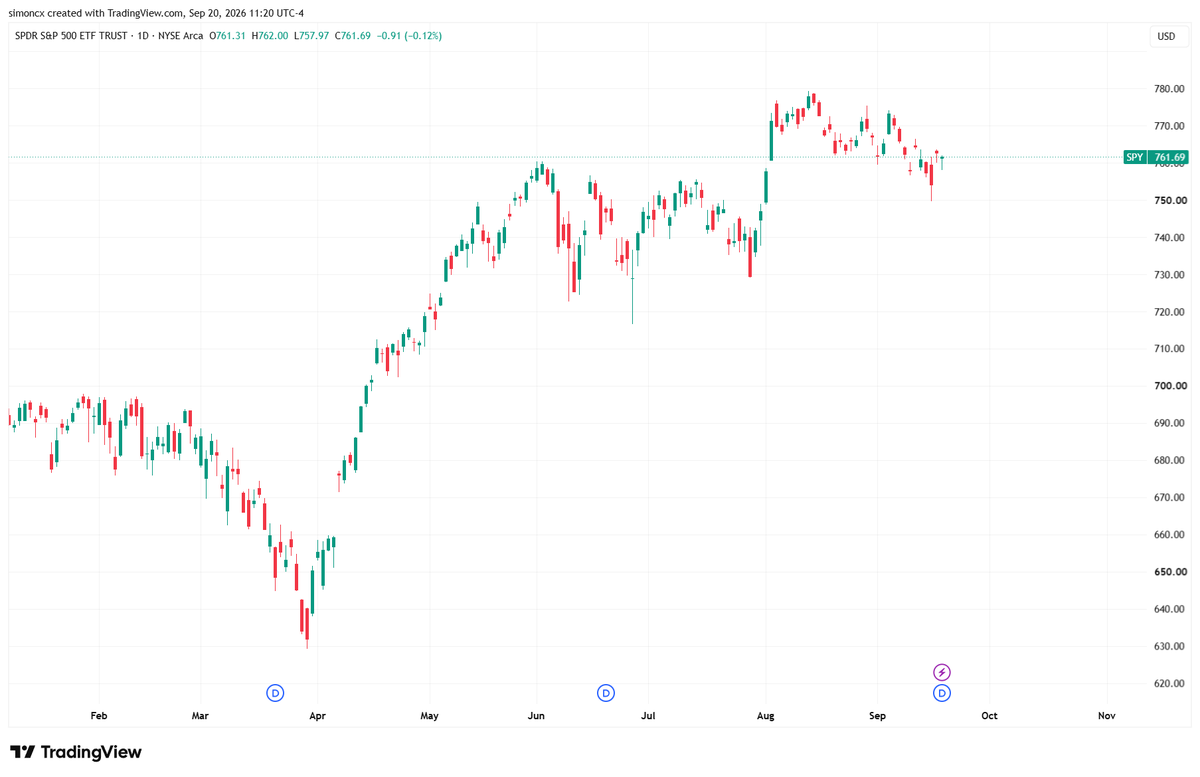
Monday's SPY map starts with Friday's range, not a forecast: 762.00 high, 761.31 open, 757.97 low, 761.69 close. A move beyond one level matters only if it holds; the map tells location, not direction.
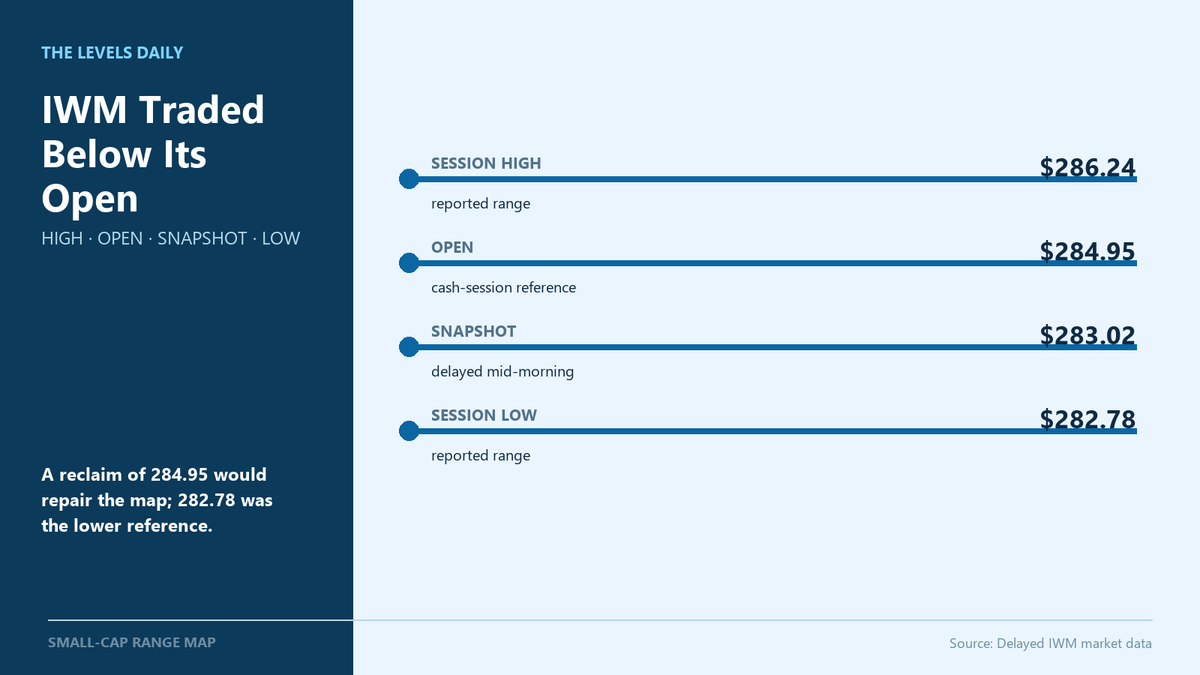
Small caps were telling a weaker story than the nearly flat Nasdaq headline in the delayed mid-morning snapshot.
$IWM had traded as high as 286.24, opened at 284.95, and was sitting at 283.02 with a session low of 282.78. In other words, price was below the cash open and much closer to the low than the high.
That location matters more to me than the red percentage alone. A sustained reclaim of 284.95 would repair the morning structure and show that buyers can take back the opening print. Continued trade below that level keeps the lower part of the range in control, with 282.78 as the first reference for whether selling is expanding or merely pausing.
This is a map, not a prediction. If IWM recovers the open while equal-weight participation improves, the small-cap lag is repairing. If it remains below the open while QQQ holds up, the market is still rewarding size and concentration over broad risk appetite.
SPY’s first-hour map had four useful references: 763.78 high, 761.32 open, 759.33 delayed snapshot, and 758.78 low.
The order matters more than the red percentage. Price first traded above the cash open, failed to hold that early extension, crossed back through the open, and sat close to the reported low in the later snapshot. That is an opening rejection, not a balanced range around the open.
For the rest of the session, 761.32 is the clean repair test. A move back above it would show that sellers no longer control every bounce. Remaining below it keeps the first-hour structure defensive; losing 758.78 would extend the rejection.
These are map references, not predictions. The snapshot is frozen around 10:20 ET, so a later market move does not make the historical sequence false—it only tells us which level the next update should mark as reclaimed or broken.
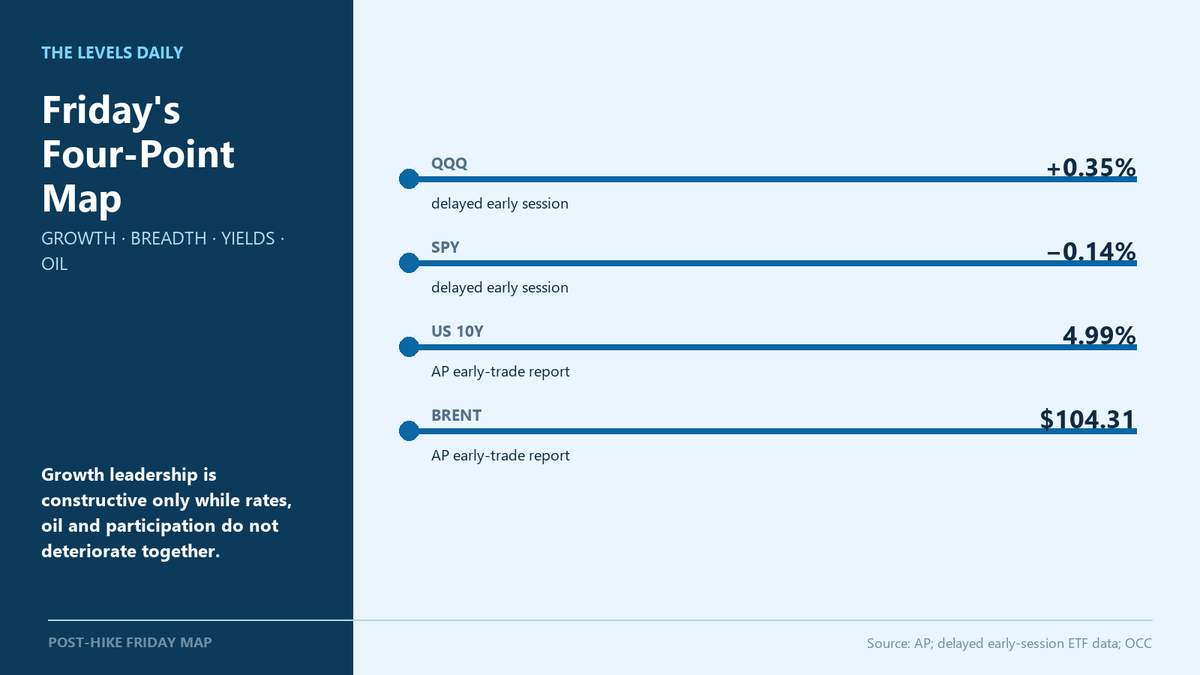
Friday’s tape needs four references, not one index headline.
In the delayed early-session snapshot, $QQQ was up 0.35% while $SPY was down 0.14%. Equal-weight $RSP and small-cap $IWM were both red, so the early strength was concentrated in cap-weighted growth rather than broad participation.
The macro side is less comfortable. AP’s early update put the 10-year Treasury yield near 4.99%, back at the edge of 5%, while Brent crude was near $104.31. Growth can lead with yields there, but the margin for another rate shock is smaller. Softer oil helps the inflation story; a reversal would remove part of Thursday’s relief.
There is also a market-structure wrinkle: September 18 is the monthly options expiration listed by OCC and the September U.S. equity-index futures expiration listed by CME. Heavy volume today can reflect positioning and expiry mechanics as well as conviction.
My map is conditional: QQQ leadership is constructive if RSP and IWM stop deteriorating, the 10-year stays below 5%, and crude does not reverse sharply. If those three confirmations fail together, a green Nasdaq print would be a narrow headline—not a broad risk signal.
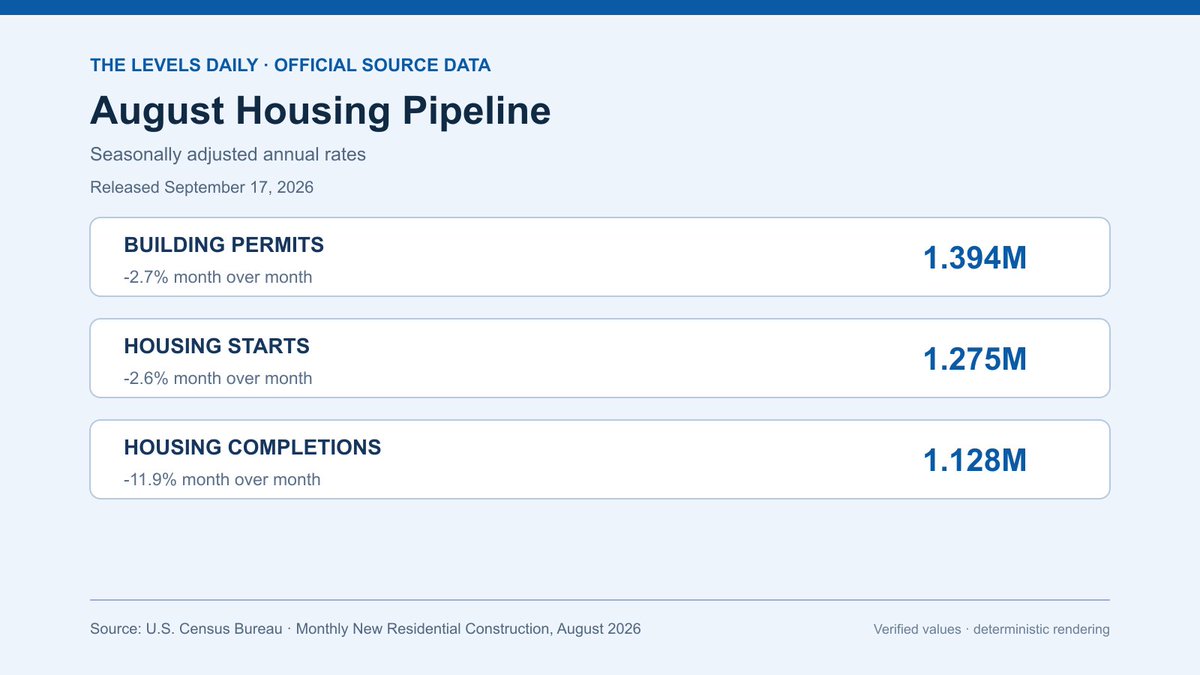
August housing data split cleanly: permits ran at a 1.394M annualized pace, down 2.7% from July, while total starts fell 2.6% to 1.275M. On the surface, that looks like broad slowing. Underneath it, single-family starts rose 7.6% to 918K, while completions dropped 11.9% to 1.128M.
Those figures describe different points in the construction pipeline. Permits are the forward-looking layer; starts show projects actually moving into construction; completions measure finished supply arriving now. August therefore did not deliver one clean “housing up” or “housing down” message.
The useful sector question is whether builders treat stronger single-family starts as the better demand signal, or whether falling permits and completions keep the emphasis on a cooling pipeline. Monthly estimates also carry wide error bands, so the next revision—and the response of homebuilder shares and mortgage rates—matters more than forcing a conclusion from one headline.