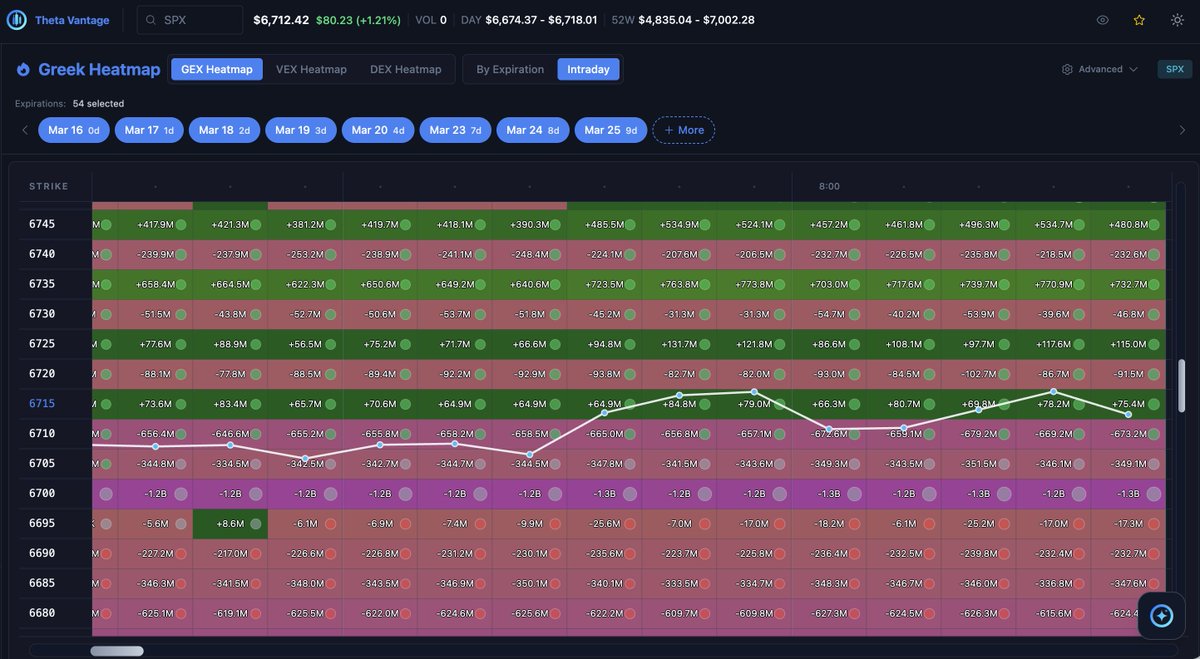
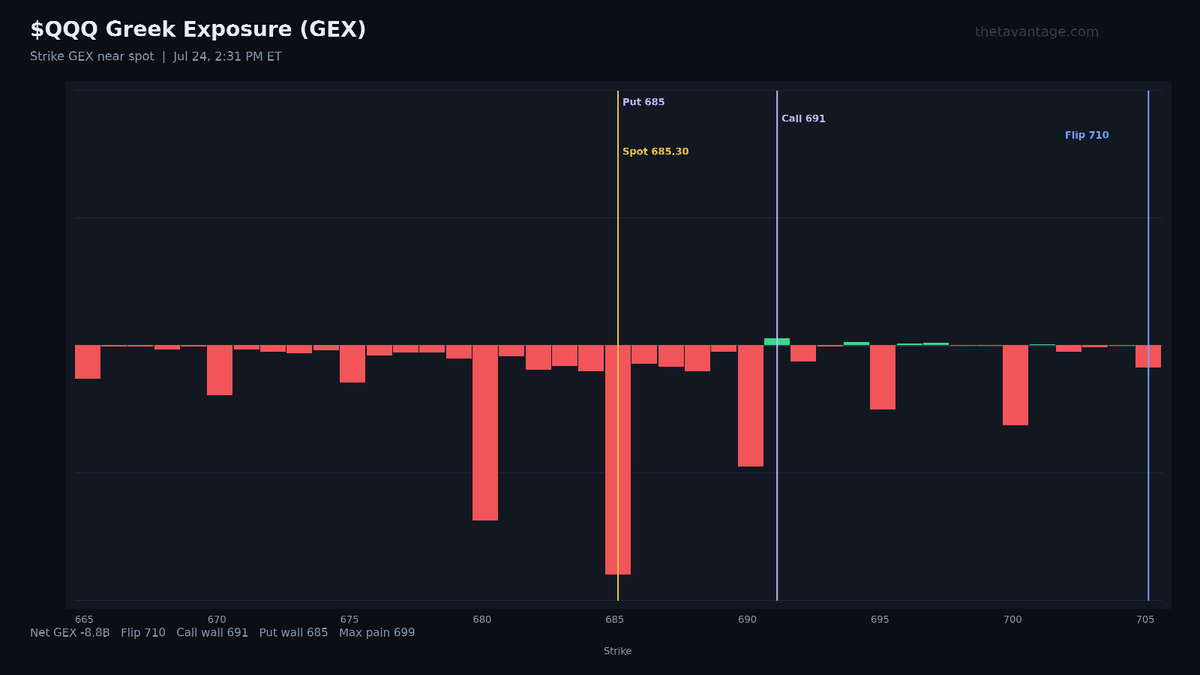
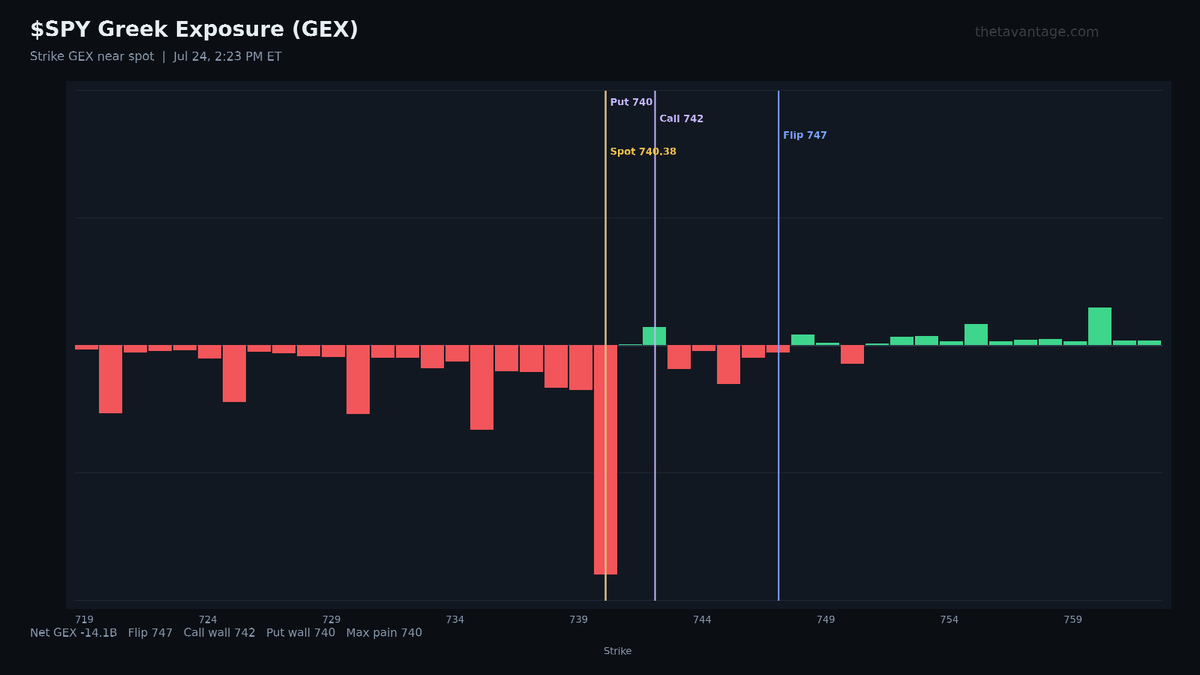
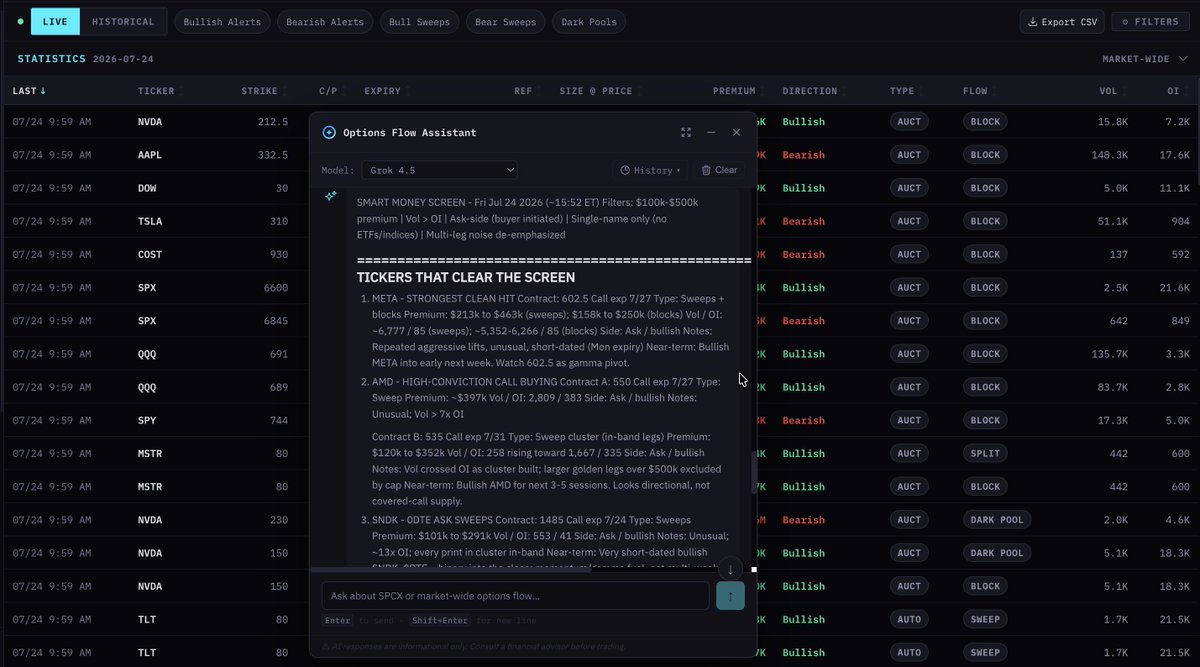
Thrilled to launch our new Intraday Greeks tool for $SPX, $SPY, $QQQ, $IWM and Mag7 (for now)! Unlock real-time gamma exposure with granular breakdowns across expirations and strikes to spot market moves early. Chat with our AI assistant for instant, expert analysis—ideal for options traders. Try it now!
$SPX, $SPY, $QQQ, $IWM, $AAPL, $TSLA, $AMZN, $GOOGL, $MSFT, $NVDA, $META
Most platforms give you a chain, a heatmap, and a pile of numbers—then leave you to figure out what actually matters.
Theta Vantage pairs live options data with AI that turns positioning, gamma walls, max pain, expected move, IV, flow, and technicals into an actionable trade thesis.
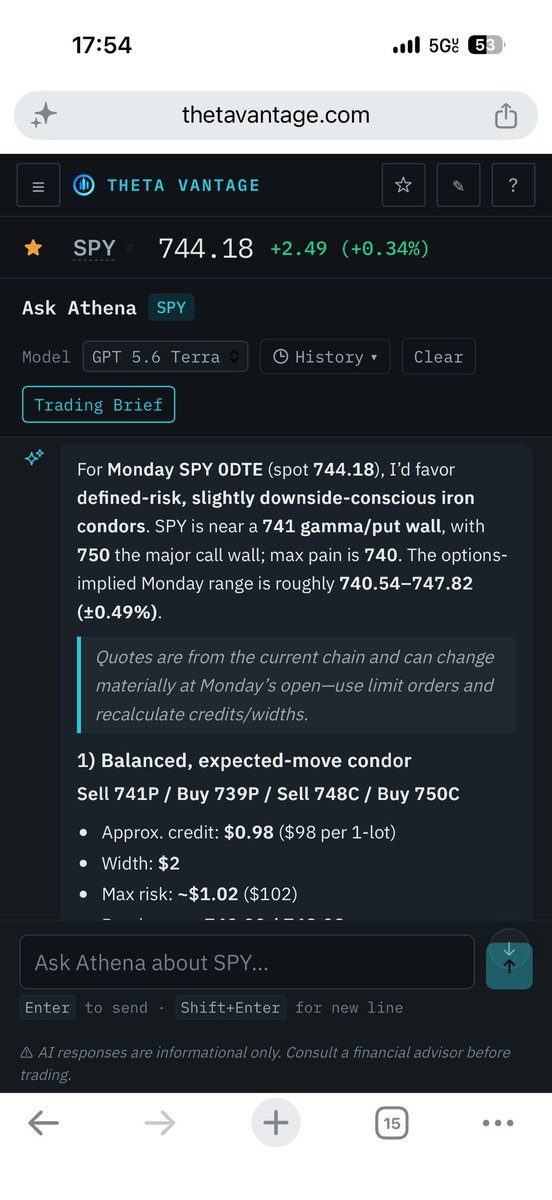
For $SPY today, that means knowing the difference between “there’s OI at 750” and understanding that 750 is the major call wall, 741 is the key downside pivot, max pain sits at 740, and the implied 0DTE range is roughly 740.5–747.8.
Data without interpretation is just a more expensive way to stay confused.
The edge isn’t having more charts. It’s knowing what the charts are telling you before the move happens.
Do your tools have access to key market data to do this?
SPY Monday 0DTE iron condor ideas
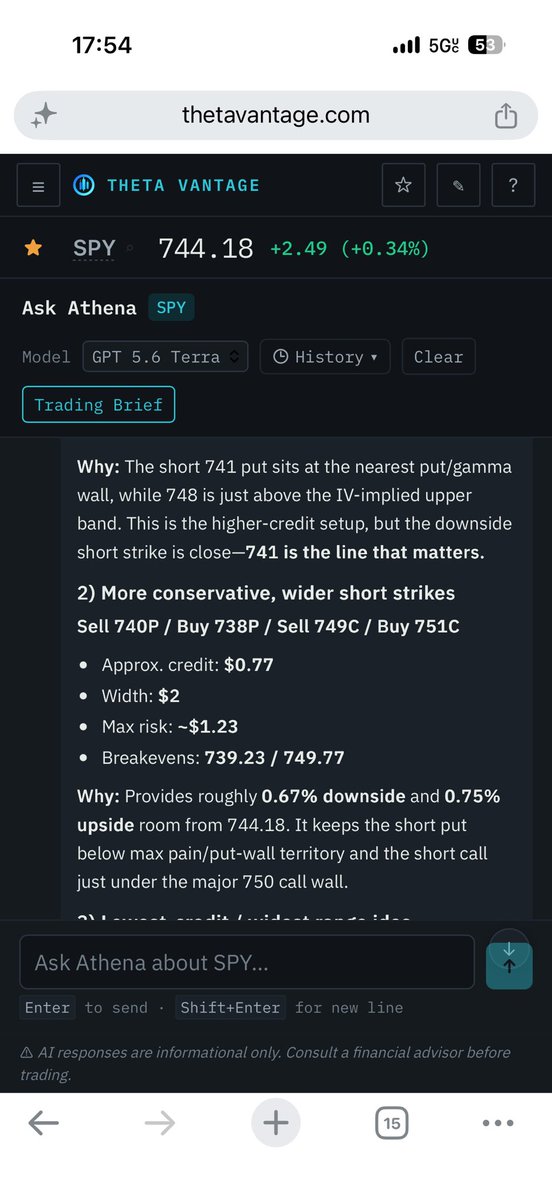
SPY spot: 744.18 Expected move: 740.54–747.82, or ±0.49% Max pain: 740 Put/call OI ratio: 1.26 Key support: 741, then 740, then 739 Key resistance: 748, then 750, then 752 Primary expected range: 740–750
1Balanced, higher-credit setup
Sell 741 put Buy 739 put Sell 748 call Buy 750 call
Approximate credit: 0.98, or $98 per condor Spread width: 2 points Maximum risk: about 1.02, or $102 per condor Breakevens: 740.02 and 748.98
This works if SPY stays contained around the implied range. The main concern is that the 741 short put is very close to spot and is the key downside gamma/put-wall level. Avoid entering if SPY opens below 741 and cannot reclaim it.
2More conservative setup
Sell 740 put Buy 738 put Sell 749 call Buy 751 call
Approximate credit: 0.77, or $77 per condor Spread width: 2 points Maximum risk: about 1.23, or $123 per condor Breakevens: 739.23 and 749.77
This is the preferred middle-ground idea. The put side is below the 741 support area and near 740 max pain, while the 749 call is just below the major 750 call wall.
3Widest-range, lower-credit setup
Sell 739 put Buy 737 put Sell 750 call Buy 752 call
Approximate credit: 0.57, or $57 per condor Spread width: 2 points Maximum risk: about 1.43, or $143 per condor Breakevens: 738.43 and 750.57
This is a range/pin trade targeting containment between the 741 put wall and 750 call wall. The credit is relatively light, so only use it if Monday’s opening option premiums improve.
Monday outlook
The near-term bias is neutral to slightly bullish as long as SPY holds 741. Multi-timeframe technicals lean bullish, but daily and 4-hour market structure remain corrective. That makes 740–750 a reasonable range thesis, but not a reason to ignore a directional breakout.
Options volatility is low: 7-day IV is 11.34%, with IV rank at 11.6 and IV percentile at 5.4. Premium is cheap relative to the past 90 days, so 0DTE condors have less cushion if realized movement expands.
Management levels
Below 741: downside risk increases; watch 740 and then 739. Above 748: upside pressure is building toward 750. Above 750: the call side becomes vulnerable; 752 is the next major options level. For a 2-point-wide condor, consider reducing or closing if the position value reaches roughly 1.5–2.0 times the credit received, rather than holding through a clean short-strike break.
Best balance of range and credit: sell 740P/buy 738P and sell 749C/buy 751C.
I’d like to introduce Athena, the AI-powered options analytics assistant I created for Theta Vantage.
Athena uses artificial intelligence to help traders and investors interpret options-market positioning alongside price action—translating dealer gamma, open interest, max pain, implied volatility, unusual options flow, expected moves, and multi-timeframe technicals into a clear, practical market narrative.
With Athena, you can quickly understand:
•Where options positioning may create support, resistance, or pin risk
•Whether dealer gamma could suppress volatility or amplify a move
•The expected move priced into options versus recent realized movement
•Important call walls, put walls, zero-gamma pivots, and max-pain levels
•Put/call open-interest positioning and notable flow sentiment
•Whether short-, medium-, and long-term technical trends are aligned
•The bullish, bearish, and volatility scenarios worth watching next
And importantly, Athena is available to free Theta Vantage users. I built her to make meaningful options context and market intelligence more accessible—not reserved only for professionals with expensive terminals.
Athena does not promise certainty; markets are probabilistic. Her role is to cut through noise, explain the positioning and levels that matter, and help traders make better-informed decisions.
Meet Athena by Theta Vantage: AI-powered options intelligence, translated into context.
Unusual options flow this hour:
1. $MRVL: 1300 calls at the 175 Jul 24, dark pool print, ~$2,273,700 — ITM 0DTE, ~$2.3M in a single name, size roughly matches OI (1300 vs 1,348), bullish
2. $SMH: 616 puts at the 525 Aug 21, split, ~$1,330,868 — OTM bearish, stacks with a 308-lot block (~$665,280) at the same strike and expiry
3. $MU: 100 puts at the 930 Aug 7, block, ~$845,200 — ITM bearish, sits alongside separate 840 and 905 put prints in the same name
4. $SOXL: 109 calls at the 140 Aug 28, block, ~$303,674 — size above OI (109 vs 72), bullish OTM, flagged unusual
5. $ORCL: 200 puts at the 115 Dec 18, block, ~$399,000 — ATM bearish
$NVDA net premium drift told the story early. Calls carried the morning, rolled over by 11:30, and the bear cross at 11:29 called the turn. Since then it's been one-way: net puts +$10.1M vs calls -$4.5M, spread -$14.5M and widening into the close. Stock ~210 at the cross, 205 now.
$SPY Greek exposure — Jul 24
Gamma flip: 747
Call wall: 742
Put wall: 740
Spot 740.4, still below the flip. GEX concentrated in the 740–742 band into expiry.
$TSLA into Wed earnings:
Spot ~381 on the 380 short-gamma node. Rejected 383 → sold the close.
Map: MP 400 | put wall 370 | call wall 410 | EM ±7.5% (352–408)
7d IV ~64% (IVR 100) → magnitude priced.
Skew still call-rich, P/C OI 0.65, MP above spot → downside direction is NOT fully priced.
Heavy capex/neg FCF only pays if we lose 370 toward EM floor.
−3% is noise. Sub-355 is the shock.
Gravity: 395–400 up / 370 down. Short gamma = expansion, not pin.
https://t.co/9JpQrVl5GP
1/ $TSLA into earnings week (Wed print).
Spot ~381
Session: rejected 383.2, dumped into the close on 380 — largest short-gamma node on the board.
Short gamma + rich IV = fulcrum, not a pin.
Expansion setup. Not quiet tape.
🧵
8/ TL;DR
TSLA: big move priced (IVR 100 front).
Downside direction is NOT fully in skew/OI.
Max pain + GEX still tug 395–400.
370 is the line in the sand for bears.
Sub-355 = where a real FCF shock shows up.
Earnings Wed. Size is paid for. Side is still an open auction.
1/ $TSLA into earnings week (Wed print).
Spot ~381
Session: rejected 383.2, dumped into the close on 380 — largest short-gamma node on the board.
Short gamma + rich IV = fulcrum, not a pin.
Expansion setup. Not quiet tape.
🧵
7/ Levels I’m watching into Wed:
Pivot: 380 (short gamma — break/hold sets tone)
Support: 370–375 (must hold or thesis accelerates)
Upside magnet: 395–400
Hard supply: 408–410
Rich IV + short gamma = whichever way it breaks, dealers can amplify it.
Not financial advice. Just the board.
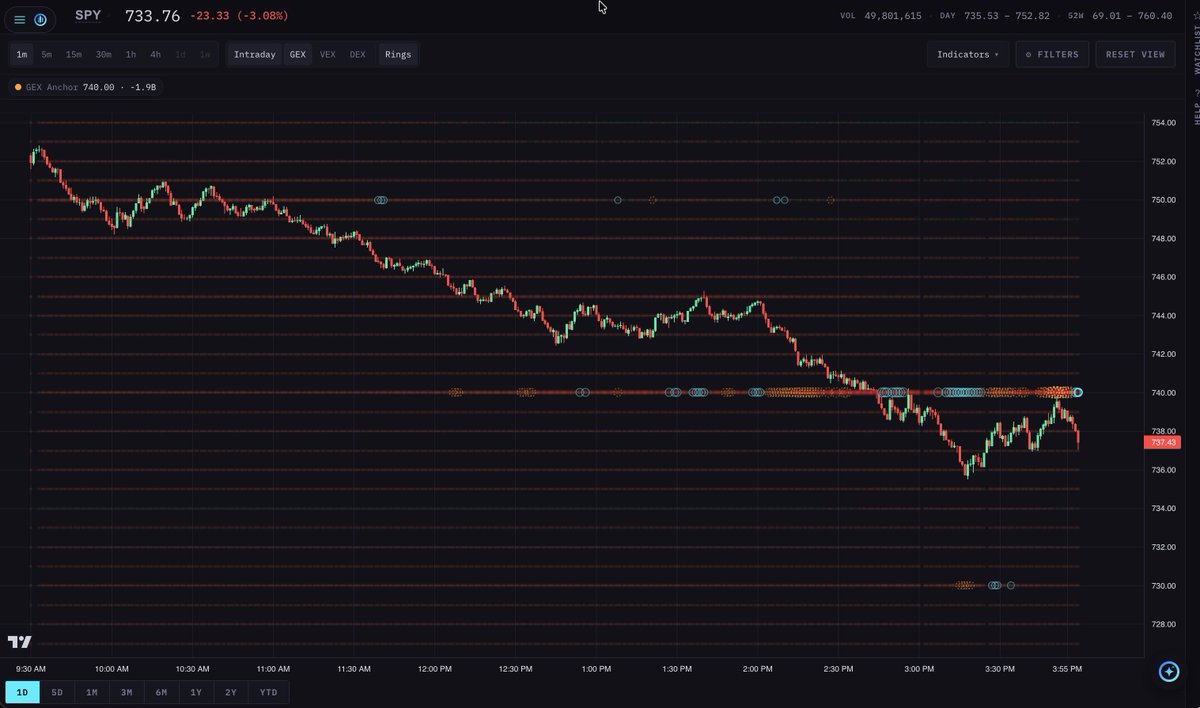
Introducing Trend Rings for the Intraday Greek Overlay on Theta Vantage chart page.
Trend Rings add a clear visual layer to GEX/VEX/DEX dots on the chart, making it easier to see whether exposure at a strike is building or fading over recent bars.
- Solid ring: exposure is growing
- Dashed ring: exposure is shrinking
- Ring intensity scales with the pace of change
This update is designed to improve decision speed by surfacing momentum shifts without adding chart clutter. It is available now in the chart view and can be toggled directly from the main overlay controls.
New Chart feature released! Visualize key indicator and intraday GEX, VEX and DEX on one page. Here is $TSLA showing GEX only for 4/20, 4/24 and 4/27 expirations and how it evolved over the last 5 days.