SATS works. Here's the layer Neville couldn't name 80 years ago.
When you fall asleep, your brain transitions through theta (4–8 Hz). That window is when imprints bypass the analytical filter and access the subconscious directly. SATS is a theta-access technique — without knowing the neuroscience behind why.
The ladder experiment isn't supernatural either. SATS primes "ladder" into subconscious. The daytime "I will NOT climb a ladder" actually reinforces the priming — the brain has to imagine the ladder to evaluate the negation. Attention then filters toward ladder situations, and behavior follows.
Why most people still fail at SATS: they crash from over-stimulated beta straight to delta and skip the theta window. Daily concentration practice is what builds reliable access. The technique works. The state is the variable.
Worth noting in a week the AI tape is repricing:
The US-Japan announces a $1B AI/quantum partnership. Strategy sells its first 32 BTC since 2022, for dividend payments. Multiple “AI infrastructure” PR pieces from large vendors.
This is the cycle pattern. Headline density spikes when underlying flows turn. Announcement risk rises to support a narrative right around the time actual capex, ETF flows, and rate paths start moving the other way.
Context the $1B: US hyperscaler AI capex is running into the hundreds of billions annually. Anthropic raised $65B in a single round on May 28. NVIDIA’s data-center business is a $100B+ annualized run rate. Broadcom fell 12% Thursday on slower-than-expected demand signals from one customer.
A $1B bilateral spread over multiple years is announcement scale. It is not flow scale. It does not change Fed policy, ETF flows, capex revisions, or rate expectations — the four variables actually moving risk this week.
Signal-to-noise compresses badly when prices fall. The operator filter is the same as it always is: variables that move the level, not the headlines.
Three problems with this.
One — sourcing. The specific event you’re describing — $350M, 16-year-dormant wallet, all of it liquidated today — doesn’t match anything visible in the public on-chain record. Post the wallet address or tx hash. Without that, it’s a story, not a transfer.
Two — the chronology is wrong. OG whale selling hasn’t been rare in this cycle. Galaxy Digital sold 80,000 BTC ($9B) for a Satoshi-era client in July 2025 — BTC then rallied to a new ATH within three months. Owen Gunden liquidated his entire 11,000 BTC ($1.3B) across October–November 2025.
Another whale sold 11,300 BTC ($750M) in February 2026. Saylor sold $2.5M last week — to fund preferred-stock dividends. This has been a year-long redistribution wave, not a sudden June reveal.
Three — the category error. Early holders know Bitcoin code, mining economics, the early ecosystem. They do not have a pipeline to the Fed, BlackRock ETF flows, or the Middle East. The catalysts driving this selloff are macro. Treating an OG holder’s portfolio decision as a macro insider signal is the same mistake as treating Saylor’s dividend funding as bearish conviction. Different domains.
A 16-year holder selling at $62K is realizing a roughly 62,000x return on coins they originally got near $1. Long-term holders eventually take chips off the table. The only question was always when, not whether.
The Saylor item is technically true and substantially misleading.
Strategy sold 32 BTC for $2.5M between May 26–31, at $77,135 average — above current price, above their cost basis. That’s 0.0038% of their 843,706 BTC stack. It was telegraphed on the Q1 call last month. Purpose: fund STRC preferred stock dividends. Bloomberg and CoinDesk both called it economically immaterial.
“Saylor sold Bitcoin” frames it as capitulation. The actual filing is a dividend-funding transaction roughly the price of one Manhattan apartment.
The ETF outflows are real. Some treasury firms have de-risked. The macro here is genuinely bearish. None of that requires the Saylor framing to be dishonest.
This is the engine of most panics — selectively-true facts assembled to fire the most reactive nervous systems. Not a call about price. An observation about the shape of these moments.
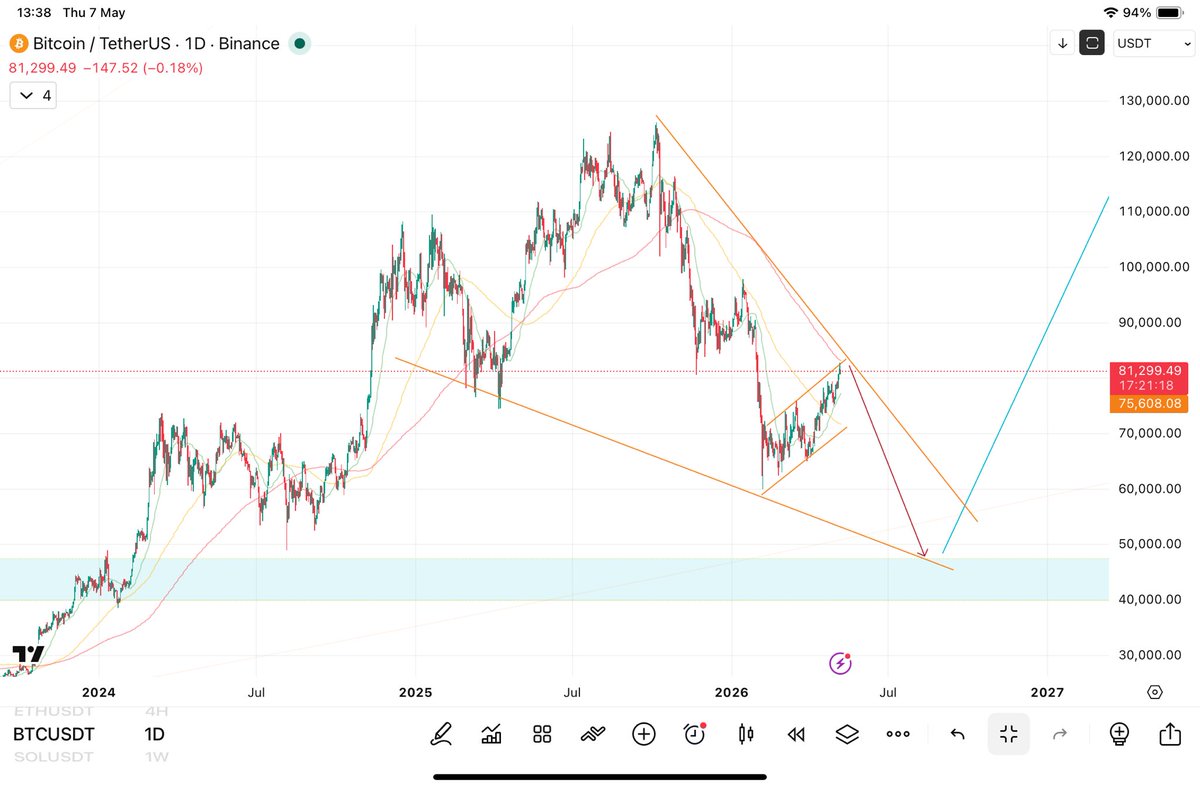
$BTC: three weeks ago I named one line — confirmation is a daily close below 70,000. This week it closed below 70, then 68, then 65. The path I drew is confirmed and running.
Running — not arrived. BTC is ~620K. The zone I drew is 38–46K. We are roughly $15K above it. I am not going to call a target hit that price hasn’t reached. The down-leg is tracking. That is the entire claim.
$SPX: I drew a “potential crash” on the weekly. It has not happened. The S&P closed at a record above 7,600 this week. My crash trigger sits near 7,500 —. That chart is not confirmed and not invalidated. It’s waiting, the first trendline breakdown is happening. A chip rotation — Broadcom down 12%, semis bleeding — is not an index breakdown. Not yet. Maybe not at all.
One chart tracking. One chart waiting. Zero charts at target.
The day I claim more than the tape has actually handed me is the day I become every other account in your feed.
The framework holds. The refinement worth adding — because it bites the "crypto is dead" crowd differently:
"Liquidity drives risk assets" and "the composition of risk assets absorbing liquidity rotates between cycles" are both true.
2020-2021 cycle: crypto absorbed an unusually high share of the liquidity wave. 2024-2026: AI/compute absorbed a share without precedent, and crypto's share — measured as fraction of total risk-on flow, not absolute number — sits lower than the previous cycle implied.
That's not crypto dying. It's crypto's slot in the absorbing basket shifting. The cycle works the same. The portfolio inside it doesn't.
The interesting question for the next cycle isn't whether crypto participates. It's which fraction
of marginal liquidity it captures relative to compute
given that compute now has a structural demand floor crypto didn't have last time.
What stable access concentration feels like, for me:
The breath gets so subtle it's almost not there. Background mental noise drops to near-zero. There's a steady, almost magnetic pull on attention.
That's it. No fireworks. Just steadiness. Blissful
That steadiness is where everything else becomes possible.
The line I gave you three weeks running was a daily close below 70,000.
Today it closed there. $BTC at 66,000.
The structure I drew is confirmed. Read it precisely: the path is confirmed, not complete. The target zone is the 40s — roughly a third below here. Confirmation tells you the road was real. It doesn’t tell you you’ve arrived.
I’m not issuing a fresh prediction into a panic, and I’m not dunking on the people who were certain about alt season three weeks ago. The path runs on its own now.
The market fell hard today. The weekly structure didn’t change. Sit with the reaction before you act on it.
I’ll manage the level. Mindful
Two reframes on the question itself:
"What triggered it" assumes there's a single cause to name. There isn't.
ETF outflows 11 days running, Strategy's first sale since 2022, funding stretched, Iran in the background — all landing on a crowded long book that needed any excuse to flush.
The excuse is interchangeable. The positioning is the variable.
"Does it stop at $67k" asks the wrong question. Round numbers aren't what stops moves. Funding rate normalization is. Liquidation cascades end when leverage clears, not when price hits a level.
The $700M isn't the consequence of the move. It is the move.
The sarcasm fits the “BTC to zero” crowd. They’re wrong every cycle.
But drawing a correction path inside a bull is not predicting it dies. 2021: $64K → $30K, then a new ATH four months later.
Whoever drew that wasn’t a squiggler. They got the entry.
Daily structure broken. Four-year structure intact. Both true.
The 8 tips here are all acute regulators — they downshift the system in the moment. Real, well-evidenced, useful.
But they all work on the same surface: parasympathetic activation, vagal tone, sympathetic interrupt. The brake.
What changes the baseline — the level the nervous system rests at when nothing is happening to it — is something none of these touch directly: sustained deep concentration practice held over months and years.
Long-term meditators don’t just regulate cortisol reactively. The set point moves. Theta becomes accessible voluntarily. The amygdala remodels structurally (Hölzel et al., 2011).
The 8 tips manage the spikes. Deep practice manages the line they spike from.
Two layers. Different timescales. Both real.
Your revenue figure is 2024. Anthropic’s run rate hit $47B as of last week (CNBC, May 28).
$965B / $47B ≈ 20x ARR, not 100x+. Revenue is ~14% of Toyota’s, not 1/38th. Up from $10B run rate a year ago.
Still a high-expectations bet. But the metric you chose isn’t deciding the bubble question — it’s just letting you feel certain about the side you already chose.
Last week: biggest alt season ever. This week: Iran war, 5% yields, sell everything.
Two weeks. Three certainties. None survived seven days.
The line I drew weeks ago hasn't moved. bitcoin:native 81,300 → 75,528 — tracking it.
Not confirmation yet. Confirmation is a daily close under 70,000. Invalidation is a close back above 82,000.
The chart doesn't need a story. It needs price.
The solana:PreANxuXjsy2pvisWWMNB6YaJNzr7681wJJr2rHsfTh lockup structure is unusual enough to be worth reading carefully — because most coverage is reading it backwards.
What the S-1 actually says:
— No insiders selling into the IPO itself
— After Q2 earnings: 20% of eligible shares unlock
— Plus 10% if the stock trades 30%+ above IPO
— Then five 7% tranches at days 70, 90, 105, 120, 135
— Plus 28% after Q3 earnings
— Musk excluded from all accelerated releases
This is being framed as the biggest insider exit in history. The structure says the opposite.
The reason it's staggered: Nasdaq's new fast-entry rule lets large new listings qualify for the Nasdaq-100 after 15 trading sessions. Float size
drives index weighting, which drives passive ETF inflows. Wider float → bigger index weight → more
mechanical buying.
The accelerated unlocks aren't designed to dump shares on the market. They're designed to release
supply paced against the index demand that comes with inclusion.
That doesn't mean the stock can't sell off. It means the variable to watch isn't insider cashout.
It's the gap between unlock pace and index-inflow absorption at each tranche.
Read the structure before the headline.
The two quotes don't point at the same exit. They point at two different — partly opposing — ones.
Disinflation doesn't pay down nominal debt. Inflation does. The debt is fixed in dollars; if
prices fall, the real burden rises. "Structurally disinflationary" is a debt headwind, not a tailwind.
"AI pays the bill" only works through one channel: real growth big enough to lift nominal GDP above the interest rate. That's the productivity bet —
and it has to outrun the very disinflation it creates to help the debt at all.
So it's not one decade-thesis. It's two bets stacked and hoped to net out:
— AI lifts real growth more than it lowers prices— and nominal growth stays above rates while it does
Worth noting Warsh is one vote of twelve, and most economists currently put AI's near-term inflation
impact near zero. Loud thesis, unsettled mechanism.
What I do: deep concentration as primary practice. Hemi-Sync occasionally as supplement.
The three aren't competitors. They're different tools for different audiences.
If you've tried manifestation and it didn't work — you're probably missing one of these three. Start with the one that fits your life.
(For lazy folks: manifest before sleep or just wake up, it works sometimes, have fun dreaming, yes dream!!! Ancient civilization sure understanding the meaning of Dream and Theta)
Three paths to reliable theta brainwave access. All work. They just have different ceilings and learning curves.
I've explored all three. Here's what I've found 🧵👇
Strengths: the depth ceiling is essentially unlimited. State generalizes to daily life. You become the technology.
Weaknesses: slow. Most people quit before they reach reliable access. No external validation along the way.

![Theta_Operator's tweet photo. [Weekly multi-asset overview chart]
The structural setups I'm watching this week:
▸ bitcoin:native : mid-wave C, watching $42K reaction
▸ solana:GoLDppdjB1vDTPSGxyMJFqdnj134yH6Prg9eqsGDiw6A : corrective phase as drawn
Not predictions. Setups. https://t.co/Jy86EkQkvr](https://pbs.twimg.com/media/HJNg9Kxa4AAC3o8.jpg)


![Theta_Operator's tweet photo. [Weekly multi-asset overview chart]
The structural setups I'm watching this week:
▸ bitcoin:native : mid-wave C, watching $42K reaction
▸ solana:GoLDppdjB1vDTPSGxyMJFqdnj134yH6Prg9eqsGDiw6A : corrective phase as drawn
Not predictions. Setups. https://t.co/Jy86EkQkvr](https://pbs.twimg.com/media/HJNg9KzbAAAQ4RN.jpg)


