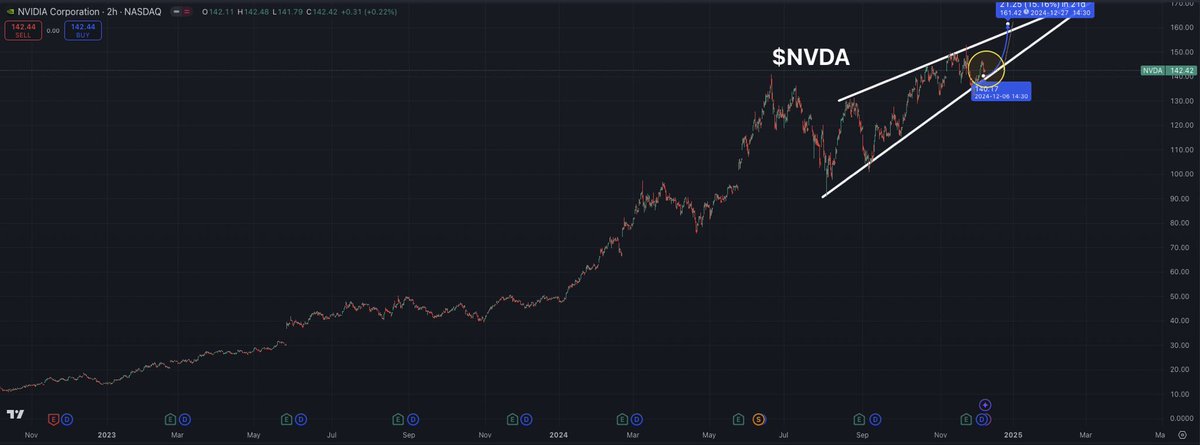
$NVDA is setting up for an extremely bullish end of year rally.
The last time NVDA had a setup like this was 6 months ago which is when it ran from $75 to $140 in 5 weeks.
This time it looks even better and bigger.
$210+ incoming for $NVDA by March 2025.
Don’t miss the move…
Santa Rally season has ARRIVED 🎅 …. and $TSLA is setting up for a move to 400+ in the next 3-4 weeks. If you want to grow your account, you need to be PATIENT and wait for this bullish setup.
Trigger: $TSLA at 350 ✅
Trade idea: TSLA Dec 16 370C 📈
Targets: 363,370 🎯
$TSLA moved 130 pts the week of the Presidential election. Since then, We’ve seen 2.5 week consolidation leading into the end of November. If TSLA holds a higher low above 334 and can breakout above 350 by Tuesday/Wednesday, TSLA can start rally to 384-400 by the end of the month. Wait for TSLA to get through 350 in order for momentum to build in the stock. This opportunity can present a great opportunity for all account sizes but we need to see a daily close above 350. Paytience 🙏
This is truly remarkable:
Since 2020, US equity funds have seen $1.09 TRILLION of inflows, the most out of any 5-year period in history.
This is nearly 5 TIMES more than Europe, Japan, and Emerging Markets COMBINED.
This year alone, US equities posted a MASSIVE $448 billion of inflows.
As a result, US stocks have widely outperformed the rest of the world.
Since 2020, the S&P 500 has risen more than 5 TIMES as much as non-US stocks.
The US stock market is in its own league.
- $AAPL is a buy below $160
- $MSFT is a buy below $360
- $NVDA is a buy below $80
- $AMZN is a buy below $220
- $GOOG is a buy below $200
- $META is a buy below $550
- $TSLA is a buy below $100
That's THE IDEAL mag 7 when to buy for me. 😄
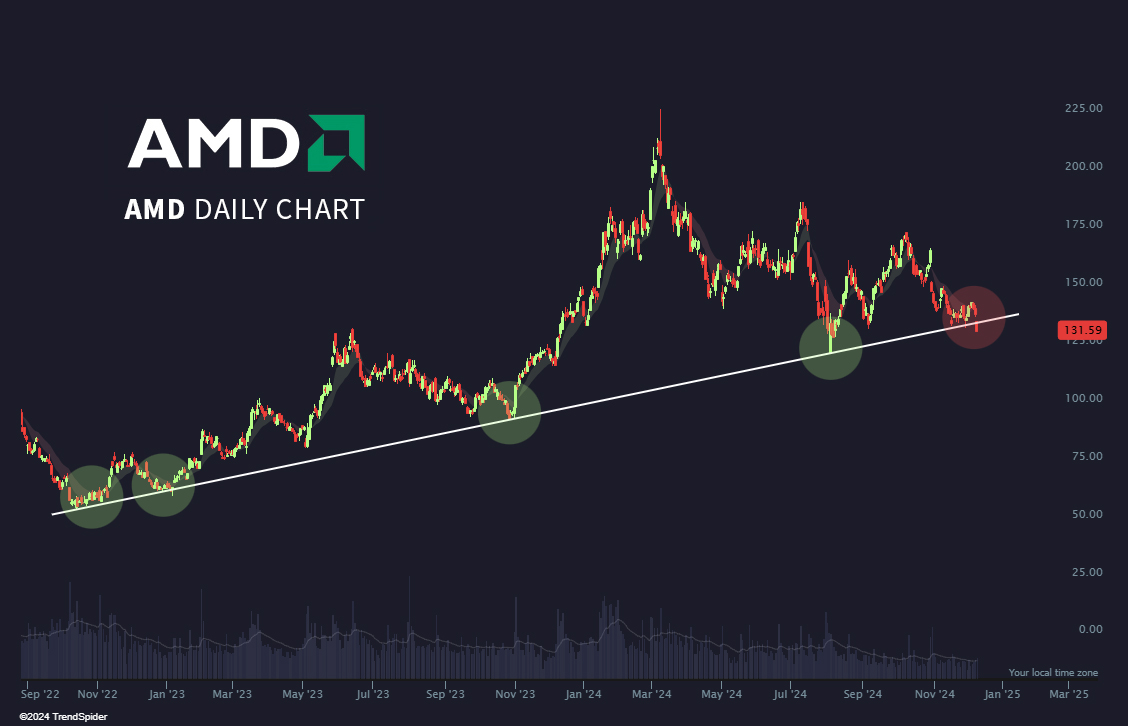
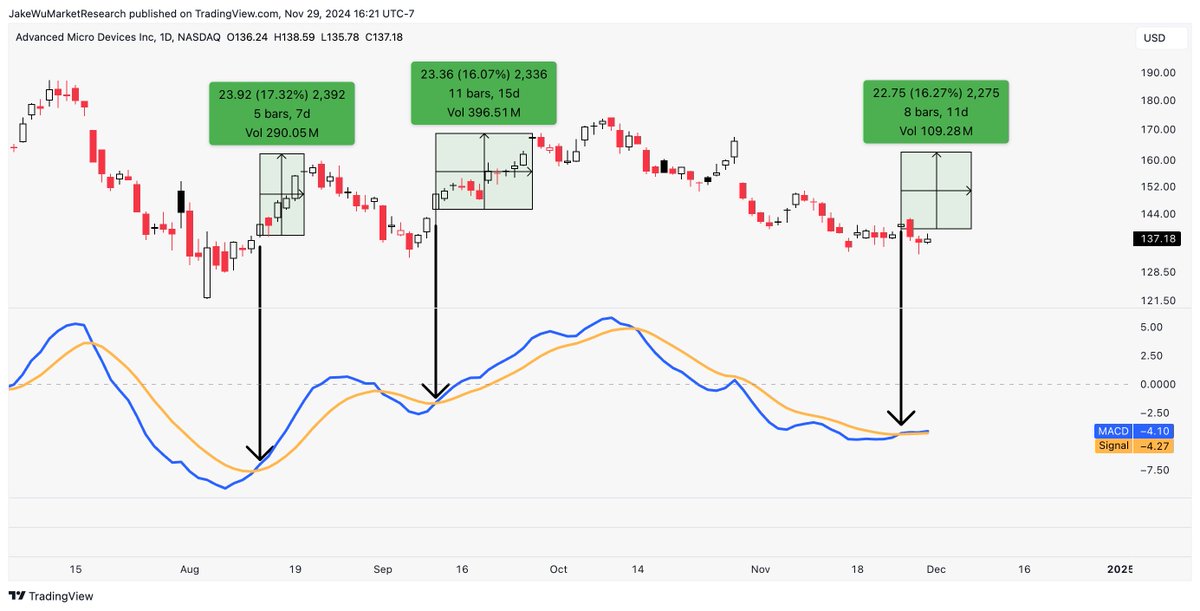
$AMD #AMD The fact this may be the shittiest trading stock on the planet is neither here nor there.
What is here is a backtest that shows us, on average, this should be around $160 by next Friday.
That would be conveniently right at the gap fill.
BREAKING: Investors bought just 16% of homes sold in the US in Q3 2024, the lowest share in 4 years.
This is ~5 percentage points below the record high seen in Q1 2022.
As a result, market share held by investors has declined toward pre-pandemic levels seen in 2019.
In total, investors purchased 49,380 homes last quarter, ~51% below the record 100,000 in Q1 2022.
Due to elevated prices and interest rates, investors are pulling out of the market due to low cap rates.
The median cap rate on a single family home is now nearly 2 percentage points below the median mortgage rate.
Not even investors can afford this housing market.
Interesting timing for $NVDA:
December has been its worst month over the last decade—just a 40% win rate and average return of -1.88%.
📊 Seasonality data: https://t.co/yIGC6ujn8m
Happy Thanksgiving, everybody! Today and every day, let’s remember the importance of giving back and showing our gratitude to those who have given us so much.