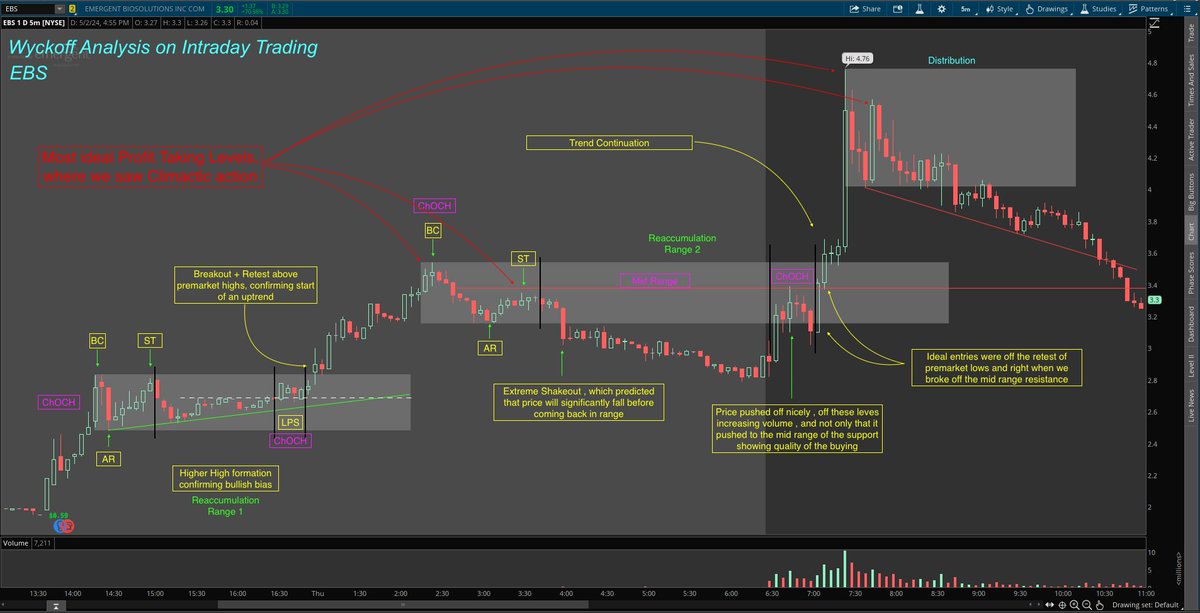
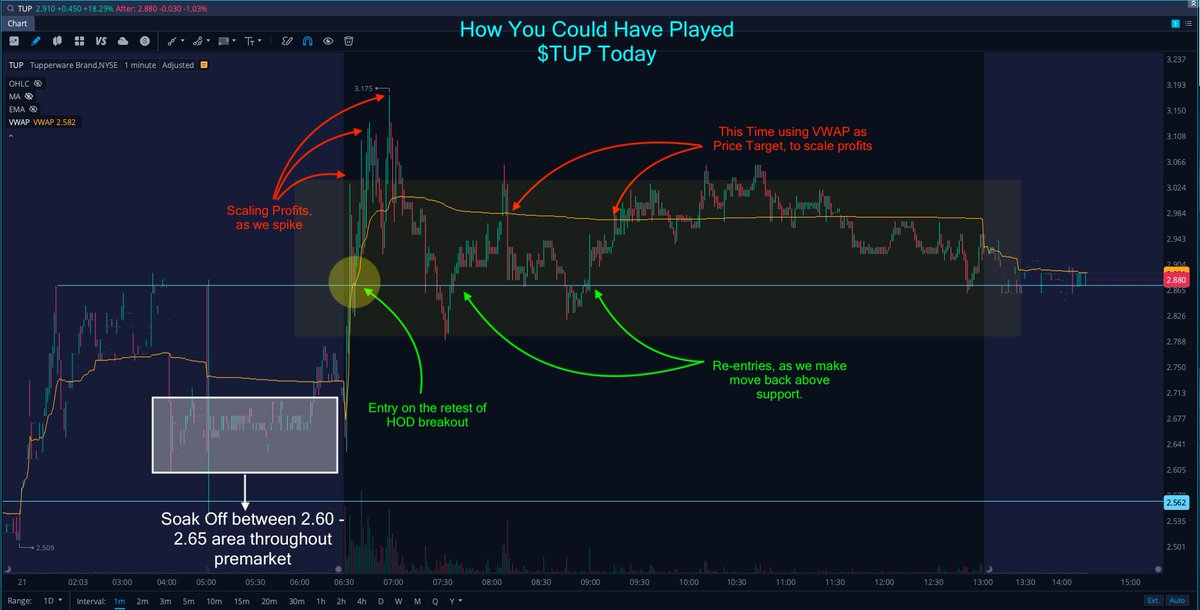
Applied Wyckoff principles to intraday trading on ticker EBS, successfully capitalizing on trade setups.
Interested in more Wyckoffian trading insights? Let me know in comments! #Wyckoff#IntradayTrading#EBS
Are you a trader that gets faked out often? Do you struggle with selling early?
Watch me explain my entries and exits on $NCNC LIVE.
My conviction kept me in the trade, and helped me avoid being faked out.
Lmk below if you think I should do more of these👇
🚀 NEW Challenge Account! 🚀
📈 Join Market Masters as we embark on a $1k to $10k Swing Trading Challenge! Are you up for the task?
🔗 Drop a like if you want to join ⚡️
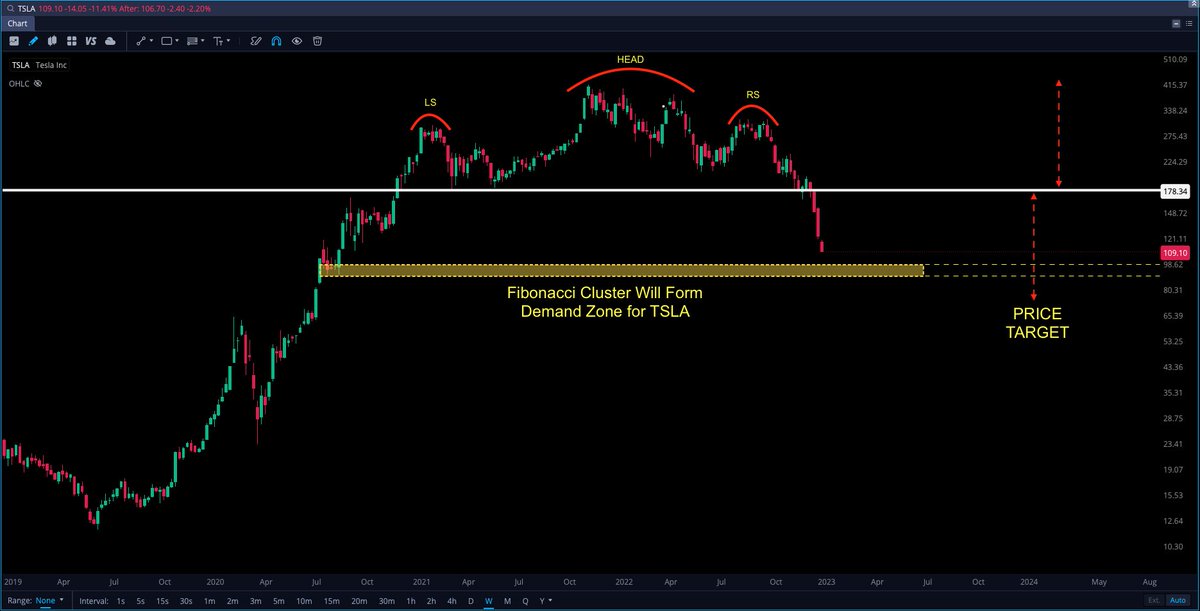
$TSLA, Head And Shoulder Top Breakout, is in action. Using Fibonacci levels, I detect a 78.60% clustering between 89.45$ and 98.62$. This is when I believe composite operators will enter the picture, play their role, and have some sort of stopping action or selling climax.
$SPY is setting up a Broadening Formation:👇
Broadening formations occur when a series of 3+ price fluctuations widen out in size so that peaks n troughs can be connected with 2 diverging trend lines. The implication of this trend is to show volatility, usually in consolidation.
Taking it to the next level… ✅
We just launched a new trading course which has **97** videos
Recorded by our team members @mm_flooded and @Thundera_Tradez
From not knowing anything, it will give you everything you need to know
$TSLA
TSLA has finally reached oversold territory. Every time $TSLA has reached these levels, it has quickly recovered. Sometimes up to 100%.
I believe we will shortly see a bounce on TSLA, if $SPY shows signs of stability.
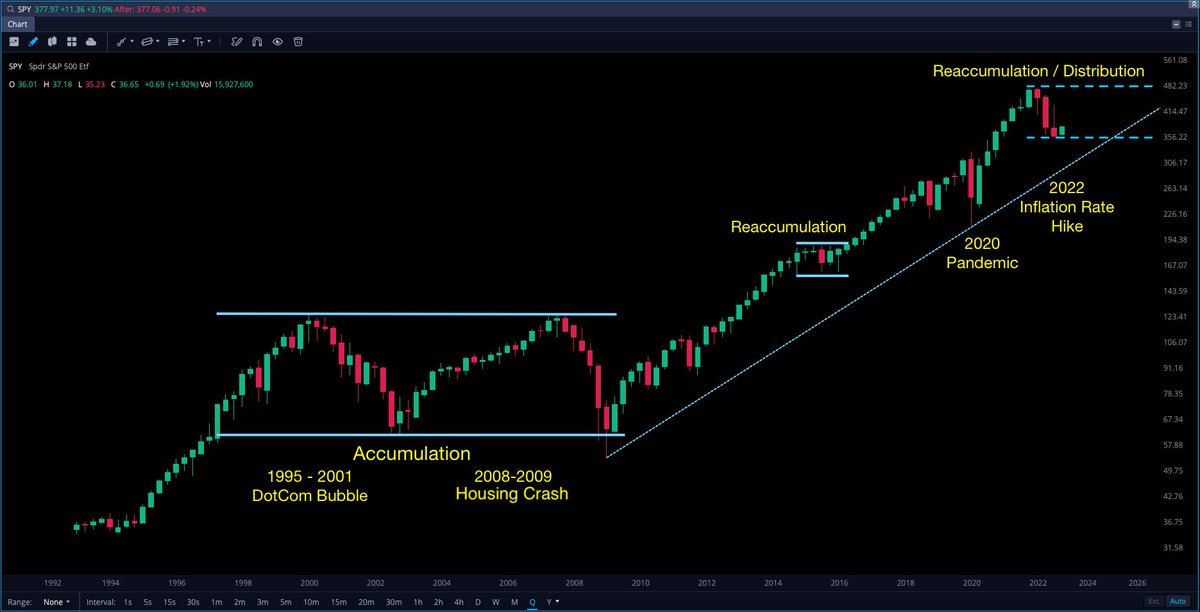
Only time will tell what occurs next, but there will be significant support on the upward slanting slope, which will be the last point of support for $SPY.
A summary chart for SPY from 1993 to 2022 shows that there were few large events on the way up, with tiny accumulation ranges forming every now and again following a major historical event.
BUT one important thing to note is that this was the first time since the lows of 2009 that we saw three red quarters back to back, indicating that the downward trend is very strong.