Markets aren't just numbers on a screen. They reflect incentives, power, liquidity, belief, and human behavior — things I've seen play out over decades.
My career started mid-90s: management consulting, investment banking (corp finance, DCM, ECM), institutional coverage for sovereign wealth funds, insurers, asset managers, hedge funds, family offices. Later private credit, private equity, and starting fund with friends.
2019 repo crisis made me look for assets outside the traditional system — ones I could self-custody like physical gold and silver. That's when crypto caught my eye. Not just as another asset, but for what DLT could eventually enable (even if it still has plenty of issues to solve).
I study history and religion because they help me understand what actually drives people, states, and markets.
Starting this account to translate macro, rates, liquidity, commodities, and crypto in plain English. No jargon. No assuming you remember every detail from last week.
Iran peace deal announced Thursday. Oil dropped 3% to $90. Stocks bounced 2%. Markets want to believe. But we've been through this 5 times since April. Here's what's different, what to watch... BTC implication.
2/ Trump's claim: "Very, very good deal" in 2-3 days, peace signed "as soon as this weekend." VP JD Vance to sign. Iranian Supreme Leader Khamenei approved the framework. 60-day ceasefire (not 2 weeks like April's failed truce).
3/ The deal: Iran reopens Strait of Hormuz during ceasefire if US lifts naval blockade. Estimate Iran pays $500M/day while blocked—economic incentive to comply. Previous April 2-week truce worked temporarily, then conflict resumed.
4/ Skepticism built in: Trump announced "2-week ceasefire" April 7 → oil dropped 16% → Bitcoin surged to $78K → then volatility returned. May 7: "swift end to war" → Tehran hadn't decided. May 28: "agreement reached" → Trump hadn't approved, key issues unresolved.
5/ What's different this time: (1) Supreme Leader actually approved, not just "signals progress" (2) VP concrete signing role vs. unnamed intermediaries (3) 60-day vs. 2-week timeline (4) Economic incentive for Iran.
6/ Market reaction if this sticks: Oil below $90 removes stagflation fears that drove it to $125+. Goldman forecasts 2 more Fed cuts in 2026 to 3-3.25%—confirmed if inflation doesn't re-accelerate. Liquidity flows to risk assets.
7/ Crypto correlation is clear: April 7 ceasefire → oil -16.5% → Bitcoin +4% to $71.8K. April 17 Hormuz reopen → oil -11% → Bitcoin +3% to $78K. Oil spikes → Bitcoin drops (March: oil +7%, BTC -3% to $70.6K). Pattern: oil drops = Bitcoin rallies.
8/ Why Bitcoin could recover: (1) Oil shock delayed Fed cuts—now accelerates (2) S&P 500 bouncing, bond yields tumbling = capital to crypto (3) Geopolitical risk-off pivots to risk-on (4) Emerging market stability (Argentina 2.1% inflation) boosts stablecoin adoption.
9/ Watch Saturday: If VP Vance signs AND Hormuz stays open → risk-off pivot confirmed. If Iran delays again → volatility returns, oil spikes back to $110+. Red flag: Tehran hasn't formally addressed proposal, "one or two" key disagreements unresolved.
10/ Bottom line: Still skeptical, but this is most concrete framework yet. Market betting on it (oil -3%, stocks +2%). If it sticks, Bitcoin could recover and oil fall below $90 removes stagflation drag. This is the catalyst Bitcoin needed.
Stubborn inflation + strong jobs + hawkish Fed = pressure on markets.
May CPI: 4.2% YoY (highest in 3 years)
Core CPI: 2.9% YoY (above Fed's 2% target)
May jobs: 172K payrolls, 4.3% unemployment
2/10
The inflation shock:
May CPI: +0.5% MoM, +4.2% YoY
Energy prices: +3.9% MoM, +23.5% YoY
This is the highest inflation since April 2023 (4.9%), surpassing April 2026's 3.8%
3/10
Core inflation's stubbornness:
Core CPI (ex food/energy): +0.2% MoM, +2.9% YoY
Key drivers:
Shelter: +3.4%
Medical care services: +3.6%
Transportation services: +4.1%
Still well above Fed's 2% target. Not transitory.
4/10
Jobs data complicates the Fed's path:
Labor market stabilizing: 172K payrolls added, unemployment steady at 4.3%
Fed problem:
Strong jobs = less need for cuts
Rising wages = more inflation pressure
Can't ease without risking de-anchoring
5/10
The Fed pivot:
Fed may drop "easing bias" at June 16-17 meeting
New reality:
70% of economists predict rates held at 3.50%-3.75% through 2026
Rate cuts in 2026: "highly improbable"
6/10
Bond market reaction:
10-year Treasury yield: ~4.57% (up from recent lows)
Bond investors fleeing gov treasuries after back-to-back inflation reports
Higher yields = gradual repricing across asset classes, not a crash.
7/10
Crypto implication:
BTC rebounded to $62K after worst week since 2022
Macro pressure:
Higher real rates = pressure on risk assets
Treasury yields up = ETF outflows
Bull case needs Fed pivot → that's now 2027+
Expect volatility.
8/10
The oil wildcard:
Middle East tensions (Israel-Iran strikes) pushed Brent +1.25% to $94/barrel
Risk:
Oil up → energy inflation up → Core up
Fed can't cut until oil stabilizes
9/10
Timeline:
June 16-17: Fed meeting (Kevin Warsh's first as chair)
No economist expects cut at June 16-17 meeting
July 7: Public hearing on Trump's proposed broad tariffs
Tariffs + oil + sticky core = inflation could stay above 4% through H2 2026.
10/10
Bottom line:
Stubborn inflation + strong jobs + hawkish Fed = pressure on markets.
Markets repricing for:
Higher yields (4.5%+)
Tighter liquidity
Pressure on risk assets
May Inflation Data Out Today + What Polymarket Says About Rate Cuts
1/ US May CPI released 8:30 AM ET
Forecast: 4.2% YoY (3-year high)
April print: 3.8% (missed by 0.1%, expected 3.7%)
Core following April's 2.8% YoY
2/ IF CPI COMES LOW (<4.0%):
Many traders expect rate cuts to follow. But Polymarket data says: NOT SO FAST.
June cut probability: 0.35%
July cut probability: 2.55%
September cut probability: 8.15%
Even with lower inflation, the Fed isn't moving soon.
3/ POLYMARKET SIGNALS:
"Pause–Pause–Pause" (Mar-Jun): 99.15% probability
→ June 16-17 meeting: 99% locked for NO CHANGE
→ July 28-29 meeting: Still 97% holding steady
→ September 15-16: First realistic cut window (but only 8%)
Fed is patient. Lower inflation ≠ immediate action.
4/ WHAT DOES THIS MEAN FOR MARKETS?
BONDS: Yields stay elevated. 10Y Treasury won't drop much even on soft CPI.
EQUITY: No rate-cut relief rally. Tech/growth still pressured by high rates.
CRYPTO: Bitcoin needs Fed pivot for major breakout. Wait till Sept/Oct at best.
USD: Stronger for longer. No cut = higher dollar.
5/ THE REALITY CHECK:
Fed needs BOTH:
✓ Inflation cooling (CPI <3.5%)
✓ Labor market weakening (jobs data)
April's 3.8% + 4 Fed dissenters + sticky jobs = Fed stays hawkish. Even if May beats low, they'll wait for more data.
September/October is the first real cut chance. December: 23% probability.
6/ ⏳ TIMELINE FOR TRADERS:
June 16-17: Pause (99%)
July 28-29: Pause (97%)
Sept 15-16: 8% cut odds
Oct 27-28: 14% cut odds
Dec 8-9: 23% cut odds (highest 2026 chance)
2026 cut probability: Only 41-44%. 56-59% chance of NO CUTS this year.
7/ BOTTOM LINE:
Soft CPI today = good for risk assets short-term, but DON'T expect Fed pivot hype.
Polymarket is screaming: Fed waits. Multiple meetings. Patience.
Markets need to reprice "cut soon" narratives. Wait till Sept/Oct for real action.
SpaceX goes public June 12, 2026 (Nasdaq: SPCX) at $135/share with a $1.75T valuation — and it's doing something unprecedented:
25-30% retail allocation (vs. 5-10% typical) = unprecedented access to the orbital economy
2/The growth is real (not just hype):
2025 Revenue: $18.7B (+33% YoY)
Q1 2026 Revenue: $4.7B
Starlink alone:
$11.4B in 2025 (+48% from $7.7B in 2024)
12M+ active users across 160+ countries (up from 9M in 2025)
~10,000 satellites in orbit
Net loss: $4.9B in 2025 (includes xAI acquisition)
3/Goldman Sachs forecasts (reported by FT):
SpaceX AI revenue:
2025: $3.2B → 2026: $15.6B (+388%)
2027: $34.5B (more than double)
2030: $322B (~100x from 2025)
SpaceX Total revenue 2030: $474B (25x from $18.7B in 2025)
Starlink: $144B
Rockets: $8.3B
Adjusted EBITDA: $6.6B (2025) → $352B (2030) (+53x)
4/Starship inflection coming H2 2026:
From S-1 filing milestones:
Starship first payload to orbit: H2 2026
Starlink V3 satellites: H2 2026 (1 Tbps downlink, 10x capacity)
60 V3 satellites per Starship launch
$15B+ invested in Starship R&D
Starship is the economic engine for orbital AI data centers
5/Orbital AI data centers starting 2028
From S-1 filing: "AI compute satellites" in sun-synchronous orbit by 2028
Why space?
Unlimited solar power (5x more energy than Earth)
Natural radiative cooling (no HVAC costs)
No permitting delays for gigawatt data centers
xAI merger (Feb 2026) = AI compute + orbital data integration
6/The valuation math:
Current P/S: ~94 ($1.75T ÷ $18.7B)
By 2030 (Goldman forecast):
Revenue: $474B → P/S = 3.7x
EBITDA: $352B → P/EBITDA = 5x
The bet: SpaceX executes 25x revenue growth over 5 years
SpaceX's S-1 claims $28.5T Total Addressable Market (AI = $26.5T, largest single-segment TAM ever)
7/Why SpaceX differs from other mega-IPOs:
Traditional mega-IPOs (Uber, Rivian, DiDi): maturing consumer apps
SpaceX: vertically integrated infrastructure with moats:
12M+ profitable Starlink customers funding moonshots
Starship = only rocket launching 60+ satellites at once
$15B Starship R&D investment
10,000 satellites in orbit (world's largest constellation)
Infrastructure compounds. Apps don't.
8/The long-term thesis:
SpaceX controls the entire stack:
Launch (Starship = cheapest per kg to orbit)
Connectivity (Starlink = 12M+ customers, 160+ countries)
AI compute (xAI + orbital data centers from 2028)
Manufacturing (~120 satellites/month, ramping)
Software (Cursor acquisition for AI coding)
This is the AWS of space + AI. TAM = $28.5T.
9/Bottom line:
SpaceX is not just another mega-IPO. It's:
Only company with 12M+ satellite customers
Only rocket company building orbital AI data centers
Only company with $15B Starship investment
Gateway to the $28.5T orbital economy
25-30% retail at $135 is unprecedented access to a 10-year compounder
10/But if you miss the IPO allocation?
You may still have opportunities to buy:
Secondary sales after IPO (brokers often offer post-IPO allocations)
Historical mega-IPOs: median 54% decline in first year, average 9% decline at 12 months
Better entry levels likely within 6-12 months as volatility settles
Wait 30-60 days for initial hype to fade, then dollar-cost average
Getting in at IPO price is optimal, but history shows better entry levels often come after the excitement fades.
The orbital economy starts now.
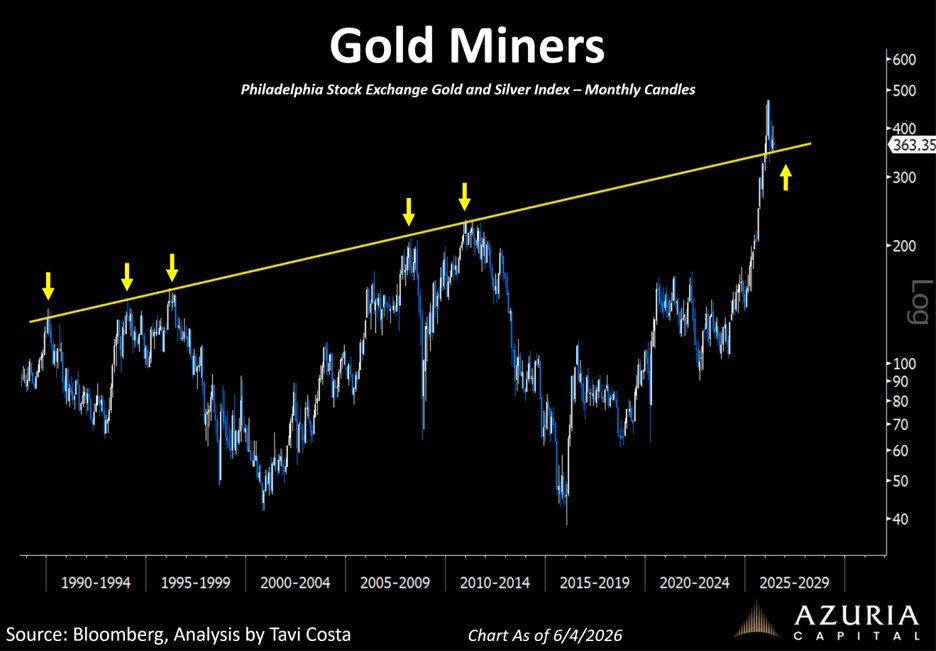
GOLD's 40-Year Resistance Breakout — What's Actually Happening
Gold broke above a resistance line from the 1980 peak (~$850/oz) that capped prices for 4+ decades. The level now appears to be acting as support around $3,300.
2/4:
Resistance origin: 1980 peak at $850/oz
Breakout level: ~$3,300 (April 2025)
Current price: ~$4,480/oz (June 4, 2026)
2025 gain: ~50-64% (strongest since 1979)
45th new ATH hit in 2025 at $4,000
Old resistance → support = classic technical pattern
3/4:
WHAT'S SUPPORTING THIS:
✓ Old resistance line now appears to hold as support
✓ Gold undervalued vs US equities historically
✓ Central bank demand
✓ Geopolitical risks + rising debt
BUT — resistance levels exist: $4,600, $4,700, $5,000
$5,200 also mentioned as "massive overhead resistance"
4/4:
WALL STREET TARGETS (Jan-Feb 2026):
JPM: $6,300 Q4 2026
UBS: $6,200 mid-2026 → $5,900 ye
Deutsche Bank: $6,000
Societe Gen: $6,000
Goldman Sachs: $5,400 Dec 2026
Morgan Stanley: $4,600 (bull $5,700)
HSBC: $4,450 year-end (range $3,950-$5,050)
Consensus: bullish, but not uniform.
There is nothing more technically bullish than a 40-year resistance level turning into major support.
That is exactly where gold miners sit today.
Act accordingly.
https://t.co/7Y87Aem7Ag
Copper hit record highs above $13,000/tonne in Jan 2026 (up 52% from Jan 2025) and is ~37% higher YoY as of June 2026. This isn't just a commodity twitch. Copper is the heartbeat of the global economy—EVs, grids, AI data centers—and its move signals big shifts in inflation, growth, and the energy transition.
2/8 — Why Copper Matters
Copper is in everything: EVs, grids, renewables, plumbing, wiring, and now AI data centers. One hyperscale AI facility can require up to 50,000 tons of copper. When copper moves, manufacturing costs, capex plans, and economic outlooks move with it.
3/8 — What's Driving This Rally?
Tariff-driven stockpiling: Markets expect a 15% US tariff on refined copper (Jan 2027, possibly 30% by 2028), triggering inventory build-ups
AI/data-center demand: ~475k metric tons expected in 2026 alone
Supply disruptions: Mine closures (Panama, Grasberg landslide, Chile drought) tightened physical supply
Financial flows: Net futures positioning hit record highs
4/8 — Physical Tightness
Copper is trading ~121% above marginal cost with only ~9 days of demand in visible inventory. The International Copper Study Group now forecasts a 150k MT deficit in 2026 — the first structural shortage since 2009. J.P. Morgan sees an even bigger shortfall: 330k MT.
5/8 — Is This Rally Temporary?
Short-term: Goldman Sachs expects prices to ease to $10,000–$11,000/tonne in 2026 once tariff uncertainty resolves and focus returns to global surplus dynamics.
Long-term: Structural demand from electrification + AI lifts prices again beyond 2026.
Key catalyst: US mid‑2026 tariff decision will determine if the correction arrives sooner.
6/8 — Will Other Metals Catch Up?
Aluminium: Already rallying — similar supply constraints + policy uncertainty; LSEG calls it a twin rally fueled by structural strains
Copper miners' stocks: Already pricing in the spike, but short-term price surges don't justify new mine CAPEX (10+ year lead times, political risk)
Gold/Silver: Recently sold off with copper; driven by different factors (rates, safe-haven demand)
7/8 — Macro Implications
Inflation risk: Higher copper → manufacturing costs ↑ → could rekindle inflation, complicating central bank policy
China divergence: Chinese refined-copper demand weakened; rally driven by Western grid/AI investment, not China property
Economic barometer: "Doctor Copper" rising usually signals strong industrial demand, but current rally is skewed by US policy + speculation
8/8 — Bottom Line
Short-term: Rally likely fades after mid‑2026 tariff clarity → correction toward $11k/tonne
Long-term: Structural deficit from 2029 onward (AI, EVs, grids) → prices rise again, but new supply won't arrive until ~2029
Aluminium is the closest catch-up proxy; watch US tariff policy for timing
The biggest macro trade nobody's talking about: Ukraine peace.
Trump's June 2026 deadline for Ukraine-Russia peace just passed with no deal — diplomacy stalled, fighting continues
But if peace is reached, here's what happens to markets ↓
2/8
The deadline reality:
US set June deadline in Feb 2026; Zelenskyy: "Americans are urging the sides to conclude the war by early summer"
June 1, 2026: deadline arrived with no agreement reached, diplomacy stalled
Russia demands Ukraine cede Donbas; Ukraine rejects this constitutionally
3/8
Recent ceasefire = failed:
May 9–11, 2026: Trump-mediated 3-day ceasefire + 1,000 POW swap announced
Both sides immediately violated: Ukraine reported 140+ Russian strikes + 850 drone attacks in the first hours
Military activity declined but didn't cease
4/8
If a real peace deal is reached: OIL crashes
Goldman Sachs: Oil could fall below $50/barrel (today: ~$92) if sanctions lift and Russian supply recovers
Why? Russian oil (≈3M bpd) re-enters global market + geopolitical risk premium evaporates
5/8
European gas: major impact BUT Europe already diversified
Today: TTF gas at €32–54/MWh (not €95 anymore) — down from 2022's €340 peak
Russia supplied 35% of EU gas pre-war. Now Europe imports mostly LNG (US, Qatar). Peace deal won't dramatically change this anymore
6/8
Ukraine reconstruction funding (verified):
€50B Ukraine Facility (EU's total program for recovery/reconstruction)
Ukraine Investment Framework: €8.4B already allocated (90% of capacity), will mobilize €25.2B in investments
April 2026: new €600M package (€450M EIB + €150M EU grants)
March 2026: new €1.5B program unlocking €3.4B investments in energy, education, agriculture
7/8
European industrials win big IF peace reached:
MSCI Europe, European construction, industrial equipment firms
Energy costs stabilize, supply chains normalize, reconstruction demand surges
But: Europe has already adjusted to no Russian gas (LNG + renewables), so impact smaller than 2022
8/8
Timeline & what to watch:
Zelenskyy: "before winter" is the realistic window for deal
Next trilateral talks: US (likely Miami) — first time on US soil
Key players: Steve Witkoff (US special envoy), Jared Kushner, Putin
Winter 2026–27 could be the inflection point
AI isn’t dot-com 2.0. It’s more like 1920s electrification — except the builders already have earnings.
I see more analogy in 1920s electrification—but this time is fundamentally different.
The key difference: infrastructure builders have real earnings.
1920s electrification ❌
Debt-financed holding company pyramids.
Opaque, hidden risks.
One business, no diversification.
Many companies collapsed, investors wiped out.
Infrastructure later became regulated utilities.
AI infrastructure today ✅
Real cash generation.
Transparent financials.
Multiple profitable businesses.
Strong balance sheets.
The hyperscalers are vertically integrated giants.
Microsoft: Azure + Office + Copilot.
Google: Cloud + Search + Ads.
Amazon: AWS + E-commerce.
Meta: AI + Ads + Feed.
Combined capex could approach $700B in 2026.
Sterling = silver. What if silver returns to its monetary role? Here's the logic:
1/ Silver was money for 5,000 years
Ancient Rome: 15:1 gold:silver ratio
U.S. Coinage Act 1792: 15:1 (official)
UK: Pound sterling originated ~775 CE as 240 silver pennies from 1 pound of silver. Switched to gold in 1717
China: Silver was used as store of value since Han Dynasty (~206 BCE), became dominant currency 1540s–1935 (Ming-Qing). 90%+ market transactions in silver by 1570. Taxes paid in silver taels
2/ Silver lost monetary role ~150 years ago
1873: U.S. demonetizes silver ("Crime of '73")
1900: U.S. officially adopts Gold Standard Act
1935: China abandons silver standard (Nov 4, 1935 currency reform)
1965–1970: Last silver coins circulate
Silver went from money → commodity in 150 years.
3/ Why silver could reclaim monetary value (5 drivers)
A. Global inflation is stuck
U.S. PCE = 3.8% YoY (highest since May 2023), 5+ years above Fed's 2% target. Confidence in fiat erodes. Hard assets regain appeal.
B. Gold already re-rated as monetary metal
Gold hit $5,000+ (record high, +68% in 2025). Central banks buying at record pace. Silver is the untouched monetary play.
C. Industrial demand provides a floor
Silver is 50% industrial (solar, EVs, electronics). Solar demand exploding. Creates a demand floor gold doesn't have.
D. Geopolitical risk is elevated
Iran ceasefire is 60-day window, not permanent. War-driven oil shocks → inflation spikes → investors flee to safe havens.
E. Currency debasement is structural
Last decade: ultra-low rates + massive QE globally. Fiat currencies lose purchasing power. Silver can't be printed at will.
4/ Observation:
Gold's monetary re-rating is already happening ($5,000+). Silver hasn't followed yet.
Given:
3.8% sticky inflation
Iran war + geopolitical risk
Gold at record highs
Central banks buying gold
Likely path: silver catches up to gold's monetary re-rating.
5/ Bottom line
Silver isn't just a commodity. It was money for 5,000 years (Rome, UK pound sterling, China Ming-Qing, U.S.). The market is pricing it as a commodity, but the monetary regime is shifting.
TL;DR:
"Sterling" = silver (UK pound originated as 240 silver pennies from 1 lb silver, ~775 CE)
China used silver as dominant currency 1540s–1935 (400 years, Ming-Qing)
Silver was money for 5,000 years, became commodity 150 years ago
Gold:silver ratio = 88:1 (record high). Historical average = 15:1
Recently on CNBC: HSBC says silver is "fundamentally overvalued", ratio will widen (not compress)
Current price: $72.13/oz (down 3.7%), after 140% surge in 2025
5 catalysts: sticky inflation (3.8%), gold at $5k+, monetary re-rating, geopolitical risk, QE hangover
Gold re-rated as monetary. Silver hasn't yet
The question: Will the ratio widen (HSBC bears, commodity trade) or compress (monetary re-rating thesis)?
The difference: commodity trade vs. monetary re-rating.
White House reviews CFTC prediction market rules — final factual breakdown
1/ Tuesday the White House confirmed OMB is reviewing a new CFTC proposal for federal event contract guidelines on prediction markets like Kalshi & Polymarket
No proposal details released yet — subject to public comment once published
2/ Key terms:
CFTC (Commodity Futures Trading Commission): US federal agency regulating derivatives; claims exclusive federal authority under Commodity Exchange Act
OMB (Office of Management and Budget): White House office reviewing proposal; notice posted on government website
DCM (Designated Contract Market): CFTC-registered exchange; Kalshi is fully CFTC-regulated, Polymarket offshore is NOT (Panama-based)
ANPRM (Advanced Notice of Proposed Rulemaking): CFTC published March 12, 2026 seeking public comment (45-day period, 3,000+ responses received)
3/ Timeline:
2022 — Polymarket settles with CFTC for $1.4M (operated unlawfully in US)
Jan 29, 2026 — CFTC Chair Michael Selig withdraws proposed ban on political/sports event contracts, announces new regulations
Mar 12, 2026 — CFTC publishes ANPRM on prediction markets
Mar 12, 2026 — CFTC Staff issues Prediction Markets Advisory on event contract listing risk
Apr 1, 2026 — CFTC sues Arizona, Connecticut, Illinois
Apr 24, 2026 — CFTC sues New York
May 2026 — CFTC also sues Wisconsin, Minnesota
May 26, 2026, 5:19 PM ET — Trump Truth Social: "It is critically important that the CFTC's exclusive authority over Prediction Markets is maintained, and that they will thrive"
May 27, 2026 — OMB reviewing CFTC proposal
4/ CFTC vs. States battle:
CFTC sued 6 states (AZ, CT, IL, NY, WI, MN) — all Democratic AGs — claiming states cannot enforce gambling laws on CFTC-regulated event contracts
16 states total have legal disputes with prediction markets (11 Democratic + 5 Republican AGs) arguing prediction markets are illegal gambling under state law
New Jersey Third Circuit court ruled NJ cannot enforce gambling laws on prediction markets; likely Supreme Court will decide final jurisdiction
5/ Kalshi vs. Polymarket — key differences:
Kalshi: Fully CFTC-regulated, operates in all 50 states, uses USD, individual trades are private
Polymarket offshore: Panama-based, NOT CFTC-regulated, uses USDC on Polygon blockchain, individual trades are public
Polymarket US: CFTC-regulated, invite-only, only sports contracts (not yet open to general public)
Kalshi cannot offer war/terrorism markets (CFTC prohibited)
Polymarket can offer war markets (offshore not subject to CFTC restrictions)
Spain blocked both Kalshi & Polymarket May 25, 2026 over lack of gambling licenses
6/ Former Chair Gary Gensler's position (May 27, 2026):
On CNBC's "Squawk Box," Gensler said CFTC lacks authority under Dodd-Frank Act 2010 to regulate prediction markets; believes states should regulate sports/political event contracts
"Congress can address this if they choose to amend it, but I don't believe that the CFTC had the capacity in 2010, or has it now in 2026, to regulate prediction markets"
7/ Trump's full quote (May 26, 2026):
"Under my leadership, we are setting 'rules of the road' that are the Gold Standard for the States. We cannot have SCUM like Chris Christie, Letitia James, Tim Walz, and JB Pritzker setting the rules! Other Countries are after this new form of Financial Market, and we want to remain at the top."
8/ What happens next:
OMB review timeline: weeks to months (proposal not yet public)
CFTC spokesperson: "Will have more to say once that process is complete"
Public comment period once proposal published
16 states likely to sue if federal rules imposed
Congress may amend Dodd-Frank for clarity
9/ Bottom line:
This is a federalism question (federal vs. state authority), not a crypto question. Kalshi & Polymarket's regulatory status differs significantly. Federal clarity helps Kalshi operate; offshore DeFi prediction markets unaffected until boundary issues arise.
CFTC Chair Selig: "The more we attempt to restrict these markets... it simply relocates offshore... we must establish appropriate rules domestically, or else we will merely foster black markets abroad"
1/8 The Fed's key inflation report (PCE) comes out Thursday. New Fed Chair Kevin Warsh's first big data read.
2/8 What is PCE? PCE = Personal Consumption Expenditures Price Index. It's the Federal Reserve's PREFERRED inflation measure (more important than CPI for Fed policy). It tracks price changes for everything consumers buy: food, energy, housing, healthcare, services. Fed targets 2% inflation using PCE.
3/8 Why PCE over CPI? PCE covers more spending categories and adjusts for when consumers switch to cheaper alternatives (like buying chicken instead of beef when prices rise). It's broader and more accurate for how inflation actually affects behavior. When Fed says "2% target," they mean PCE.
4/8 Current inflation situation: March PCE showed headline inflation at 3.5% YoY (up from 2.8% in February). Core PCE (excluding food/energy) at 3.2% (fastest since late 2023). Both are rising, not falling. April report expected to show even higher: headline ~3.8-3.9%, core ~3.3-3.4%.
5/8 Why is inflation rising now? War-driven energy shock. Oil prices jumped back toward $100/barrel. Gas prices surging.
6/8 What to watch Thursday (8:30 AM ET):
Headline PCE YoY: 3.8-3.9% expected
Core PCE YoY: 3.3-3.4% expected (this is what Fed watches most)
Monthly Core PCE: 0.25-0.30% expected
Also: personal income + spending data
7/8 Consumer sentiment already at ALL-TIME LOW (44.8, worst since 1978 survey started)
8/8 Bottom line: Thursday's PCE report will tell us if war-driven inflation is temporary or persistent. Warsh's first test. If core stays above 3.3%, rate cuts likely pushed back. Continue to watch energy prices.
SpaceX isn’t just going public. It’s walking in with Nasdaq having already rewritten the rules for it.
- 10% minimum free-float? Gone.
- Seasoning period for index inclusion? Slashed from 3–12 months to 15 trading days.
- Low-float weighting? Now 3x for companies under 20% float.
https://t.co/gTDdukuVrD
What that means:
Free float: % of shares actually tradable. Old rule required ≥10%. New rule: no floor, so tightly held companies can join.
Seasoning: time a stock must trade before joining major indices. Old: 3–12 months. New: 15 trading days for mega-IPOs in the top 40 by market cap.
Low-float weighting: if float <20%, index weight = 3× actual float, capped at 100%.
Passive funds tracking the Nasdaq-100 can be forced to buy SpaceX almost immediately, at an inflated weight, before price discovery even starts. They can't opt out.
At a $1.75T valuation and ~$80B raise, this is the biggest IPO ever — and it looks less like normal price discovery than a forced liquidity event for passive capital, where the rules ensure massive mandatory buying almost immediately, regardless of whether the valuation is right.
If Elon wants this to be a win for everyone, not just insiders, he need to create real value. Deliver returns that justify this valuation, keep building the future, and make sure this doesn’t become a story about how passive investors were forced into a bad bet at the start.
1/ Mega-IPOs do affect liquidity.
2/ Not because the market buys the whole company, but because it has to absorb the public float (how much of the company is actually available for people to trade, excludes the shares locked up with founders, insiders, or long-term holders)
3/ Investors often rotate capital out of other positions, or hold cash back, to participate in the deal.
4/ If you want to quantify the impact, I think 3 numbers matter most:
Market value.
Free float.
Expected upside / secondary performance.
5/ Market value tells you the headline scale.
6/ Free float tells you how much actually hits the public market.
7/ Expected upside tells you how much extra capital may be pulled in by the IPO story itself.
8/ So the liquidity question is not just “how big is the company?”
9/ It is: how much of it is floated, how much capital is required to absorb that float, and how much incremental demand comes from upside expectations?
10/ That is why the next wave matters.
11/ SpaceX looks like the first big liquidity test, with a reported target around June 2026.
12/ OpenAI looks like the next major one, with IPO groundwork already being discussed in the market.
13/ Anthropic is the third name to watch, though its timing is still less certain.
14/ If these deals overlap, the liquidity effect gets more pronounced.
15/ If they come one by one, the market can digest them more easily.
lol so china's basically monetizing trade imbalances through gold appreciation instead of printing into fx reserves -- creditors get paid in appreciating collateral that doesn't show up as a liability on pboc's balance sheet. cleanest deficit financing since oil-for-gold in the 70s
What If the Next "Plaza Accord" Is About Gold?
1/ In 1985, the Plaza Accord forced JPY & DEM to appreciate vs USD to fix US trade deficits. Yen rallied from 240→120/USD in 2 years—crippling Japanese exports and contributing to the Lost Decade.
2/ What if the next Plaza Accord looks different? Some analysts suggest the target might not be JPY or CNY—but gold itself, via a concept called the Mar-a-Lago Accord.
3/ The US Treasury holds 261.5M oz gold (8,133 metric tons)—the world's largest reserve, 2.5× more than Germany.
4/ Official book value: $42.22/oz (set by Congress in 1973) = ~$11B on the balance sheet.
5/ At current market price (~$4,600–4,700/oz as of May 2026), that gold could be worth ~$1.2–1.3T—over 90× the book value.
6/ If the US revalued gold to market price, it could theoretically create ~$1.2T in Treasury equity without selling a single ounce.
7/ Treasury Secretary Scott Bessent hinted at this, saying: "We're going to monetize the asset side of the U.S. balance sheet for the American people"—possibly referring to gold. Though he later said there are no immediate plans.
8/ At US debt of $39.17T (May 2026), this could help fund deficits, pay down debt, or seed a sovereign wealth fund—if it happens.
9/ Why gold instead of JPY/CNY? Countries won't agree to appreciate (they saw what happened to Japan). Gold revaluation is an accounting move that could debases the dollar without officially devaluing it vs major currencies.
10/ Historical precedent: US raised official gold price 35→38 (1972)→42.22 (1973), creating ~$800M in equity without selling gold.
11/ The speculative play: US bids up gold via bullion banks → announces new official price → cash-settles COMEX futures at lower price (physical delivery shortfall). Echoes: 1933 gold confiscation + 1971 gold window closure.
12/ If this happens, gold could target $6,000–10,000/oz. Jefferies' Christopher Wood forecasts $10K; JPMorgan $6,300; Deutsche Bank $6,000; UBS $6,200. The dollar might debasement, yields fall, US gets liquidity for re-industrialization.
13/ Bottom line: The next "Plaza Accord" might not be about JPY or CNY. It could be about gold revaluation—a balance sheet option for a $39T debt country.
The Cantillon Effect is simple: new money doesn't help everyone equally. The people closest to the money creation — usually banks and financial markets — get the benefit first, before prices rise for everyone else.
When people say the Fed is "printing money," they usually mean it's buying Treasuries and crediting bank reserves electronically. So it's not literally printing paper, but it is adding liquidity to the system.
And when yields start moving higher, that pressure can grow. If the Fed steps in to buy bonds and keep yields under control, that's still money creation — and it usually shows up first in asset prices.
Key Level: 5% on the 10-year Treasury
The administration appears to be defending 5% as an informal ceiling.
Oct 2023: 4.99% peak (last breach, Biden era)
Jan 2026: 4.78% pre-inauguration peak
May 2026: 4.61% current (after SLR cuts, buybacks)
What to watch:
If 10-year approaches 4.8-4.9% → expect policy intervention (Supplementary Leverage Ratio reduction i.e. banks can lend more relative to their capital, Treasury buybacks)
If Fed is forced to cap yields → that's "stealth Yield Curve Control" (money creation)
First beneficiaries: banks, financial assets, then everything else
The 10-year Treasury yield is perhaps the most important financial benchmark in the global fiat system, as it drives valuations and market trends worldwide. It is widely—and erroneously—regarded as the risk-free rate of return.
The 10-year Treasury yield can be thought of as a key barometer of the US dollar-based fiat system—a critical measure akin to its beating heart.
Bond yields move inversely to bond prices. When bond prices fall, bond yields rise.
A rising 10-year Treasury yield signals trouble for the US dollar because it means investors are selling Treasuries, which pushes up the US government’s borrowing costs. That is why the 10-year Treasury yield is a major pain point for the US government.
The 10-year Treasury yield was 3.97% when the war started. Now it is around 4.60%, an increase of roughly 63 basis points.
I expect the 10-year Treasury yield to keep climbing over the coming weeks and months—until it forces the Fed’s hand. At that point, the intervention will be sold as “stability,” but the mechanism will be familiar: suppress yields by debasing the currency.
At today’s debt levels, every 1 basis point increase in the government’s average borrowing cost adds roughly $3.9 billion in annual interest expense. So a 63 bps rise is not trivial—it translates to nearly $250 billion in additional yearly interest costs, materially widening a 2025 budget deficit that was already around $1.8 trillion.
Higher yields mean the US government must pay tens or even hundreds of billions more in interest on its debt. At the same time, the global economy faces even greater added costs because Treasury rates serve as the benchmark for borrowing worldwide.
That is not an insignificant move. However, given all the headwinds I have discussed, I suspect the 10-year Treasury yield is headed much higher because investors will demand higher yields to compensate for rising inflation. Further, if Hormuz remains closed, drastically higher oil prices are all but certain. Higher energy prices mean higher prices across the economy and higher official inflation rates, which means investors will demand still higher yields to compensate.
The problem is that interest on the federal debt is already over $1.2 trillion and is now the second-largest item in the budget. The US government cannot afford yields going much higher because the interest expense would push it toward bankruptcy.
I am not sure how—or even if—the US government can manage this situation. Something has to give, and we will not have to wait long to find out what.
The Iran war may prove to be more than another foreign policy disaster. It could be the trigger that exposes the fragility of the entire dollar-based financial system.
SEC's "Innovation Exemption" for Tokenized Securities: What's Actually Being Proposed
The SEC's Innovation Exemption is being hyped as a game-changer. But there's confusion about scope. Here's what's confirmed vs. unclear 👇
1/ What's CONFIRMED
SEC Chair Paul Atkins announced an "innovation exemption" under Project Crypto — a regulatory sandbox letting qualified firms issue and trade tokenized securities on-chain for 12–36 months without full SEC registration.
2/ Scope: What Assets Are Covered?
Atkins explicitly framed it as keeping "tokenization of equities, bonds, and other real-world assets inside U.S. markets".
This includes:
Equities (public stocks)
Bonds (fixed income)
Investment funds (ETFs, money market funds, mutual funds)
Other RWAs (real estate, treasuries, etc.)
NOT limited to public equities only.
3/ What's UNCLEAR: Private Securities
The exemption focuses on on-chain trading infrastructure for tokenized securities, but private equity/private credit still operate under:
Reg D (US private placements to accredited investors)
Reg S (offshore offerings to non-US persons)
No clarity that the innovation exemption overrides these.
4/ Why Private Assets Are Different
Private securities have separate compliance requirements:
Accredited/qualified purchaser requirements
Transfer restrictions
No public disclosure obligations
Issuer cooperation typically needed
Blockchain tokenization doesn't change underlying securities law.
5/ Key Conditions for Innovation Exemption
Qualified firms must meet:
Trading volume caps
Whitelisting for buyers/sellers
Periodic SEC reporting
Commit to full compliance by deadline or demonstrate decentralization
Not a free pass — it's a controlled sandbox.
6/ Bottom Line
✅ Clear: Tokenized equities, bonds, RWAs can trade on-chain under 12–36 month sandbox
⚠️ Unclear: Whether private securities (Reg D/Reg S) are covered
✅ Certain: Private assets still need separate private placement compliance
This is about on-chain market infrastructure, not blanket deregulation of private securities.
There’s an interesting Texas slang phrase: “post turtle.”
It means a turtle sitting on top of a fence post — clearly it didn’t get there by itself, and it has no ability to get there on its own. It was placed there, and eventually it can only fall off.
That also makes you think about what it means to “help” something.
Is helping a turtle putting it on a post so it can see farther? Or is that just putting it somewhere it was never built to be?
In life, the same idea applies to investments, work, opportunities, leadership, governments, and fame.
If something is only “up there” because it was carried there, propped up, or pushed there, the real question is whether it can stand on its own, for how long, and how much damage it will do when it falls.
The height is not the test. The ability to stay there — and the purpose behind it — matters. Bigger-picture thinking may help you make better decisions.
Quick refresher: what to watch beyond headline inflation
Higher inflation doesn’t automatically mean rate hikes.
Central banks only hike if they see inflation as persistent and feared, not just noisy or supply‑driven.
2/ When hikes do come, they mostly move short‑term rates (overnight, 2–3y).
But long‑term rates are driven by expectations: how long hikes will last, how high they’ll go, and how quickly policy will ease again.
3/ Higher expected inflation → higher discount rates → lower equity multiples, not necessarily lower equity prices.
For bonds, longer duration = bigger hit when long‑term yields move up.
4/ For commodities like gold, the story is more nuanced:
Rising inflation often supports gold as a fiat‑eroding hedge, but
Faster‑rising real yields and a stronger dollar can pressure it, especially if liquidity is draining.
So gold trades the balance between “inflation fear” and “tighter‑money / deleveraging.”
5/ Of course, inflation and rates aren’t the only story.
Liquidity shocks, AI‑driven flows, or sharp drops in one asset (e.g., credit, crypto, or rates‑sensitive equities) can force de‑risking and fire‑sales in others—moving prices above and beyond what yield‑based valuation alone would suggest.
So always ask:
Is this move driven by rates & expectations, or by liquidity & forced selling?
Quick refresher: what yield means for your asset allocation.
Yield is the “interest rate” you earn on fixed‑income assets.
If yields go up, newly issued bonds pay more, so your old lower‑yield bonds become less attractive. Their price drops to compensate.
2/ Duration = how sensitive your bond is to rate changes.
The longer the duration, the more negative the impact on your return when rates rise.
If rates go up and new bonds pay more, people are only willing to buy your older bond at a lower price.
So a long‑duration bond’s price falls more than a short‑duration one for the same 1% hike.
3/ If you expect yields to go up:
Locking into long‑term deposits or long‑duration bonds works against you.
Each rate hike hits your unrealized return harder the longer the maturity.
Duration isn’t just jargon—it’s how much “rate risk” you’re taking
Three bond markets on three continents are breaking at the same time.
US: The 30-year yield is at 5.085%. The 20-year at 5.092%. The 10-year at 4.538%. Every maturity rising together. The government is running a $2 trillion annual deficit and borrowing more every day to fund a war.
UK: Gilt yields just hit 5.13%, the highest since 2008. A leadership challenge to the Prime Minister, combined with global inflation fears and the same energy shock, is crushing British sovereign debt.
Japan: Wholesale inflation came in at 4.9%, nearly double the 3.0% forecast. Naphtha up 79.4%. The 30-year JGB yield hit 4.00%, a record for a country that spent three decades in deflation. The Bank of Japan is under pressure to hike rates in June.
The common thread: the Strait of Hormuz closure is injecting an energy shock into every major economy simultaneously. Oil spikes, wholesale inflation follows, bond markets reprice, and governments that borrowed trillions at near-zero rates discover what 5% actually costs.
Stocks are at all-time highs because AI earnings are real. Bond yields are at multi-decade highs because sovereign debt loads are also real. Both cannot be right. And historically, it is not the bond market that is wrong.