Statistically #NASDAQ#VIX
Historical frequency (Nasdaq / NQ behavior)
Using typical thresholds:
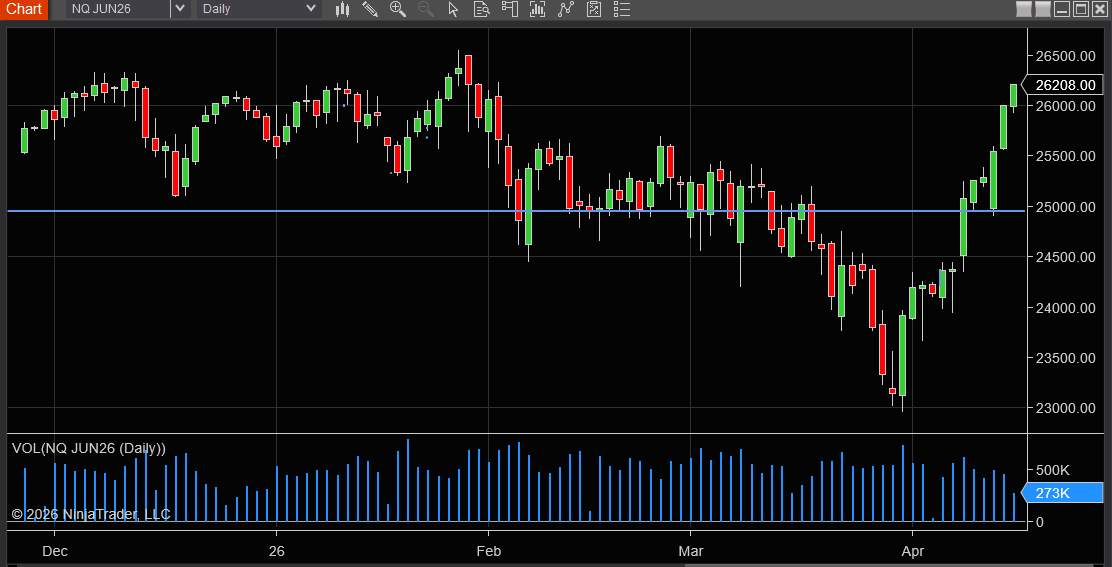
+8–10% in ≤10 trading days
+12–15% in ≤15–20 trading days
Observed frequency:
Move TypeFrequency
+8–10% in 10 days~3–6 times per year
+12–15% in ~3 weeks~1–3 times per year
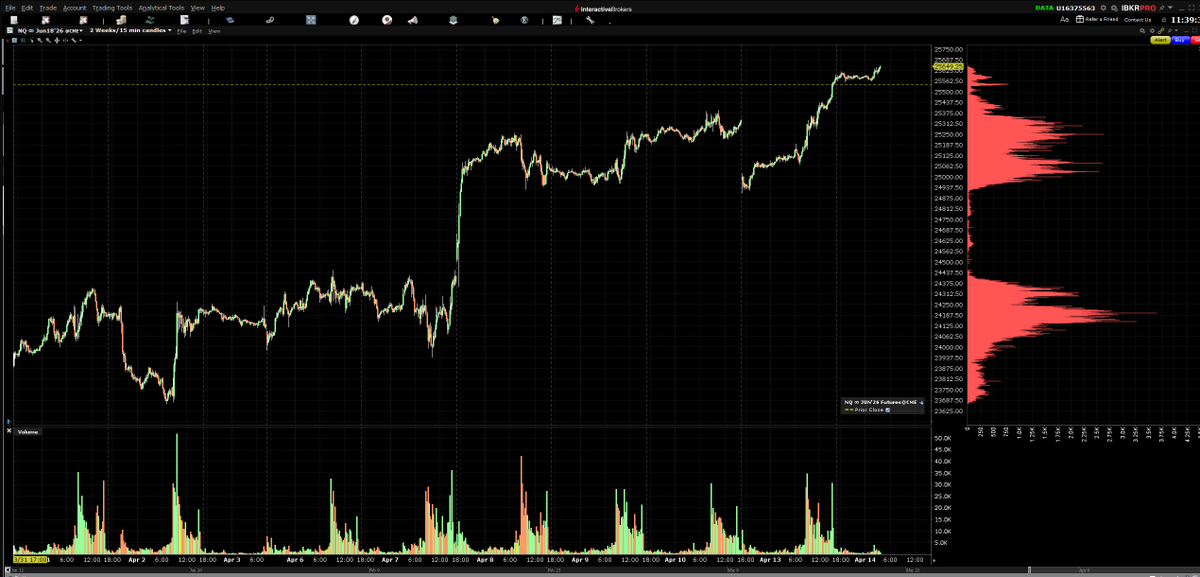
V-shaped rallies (like this)~2–4 times per year
Probabilities (Short-Term: next 10–30 minutes)
🔻 Pullback Probability: 65–75%
Why:
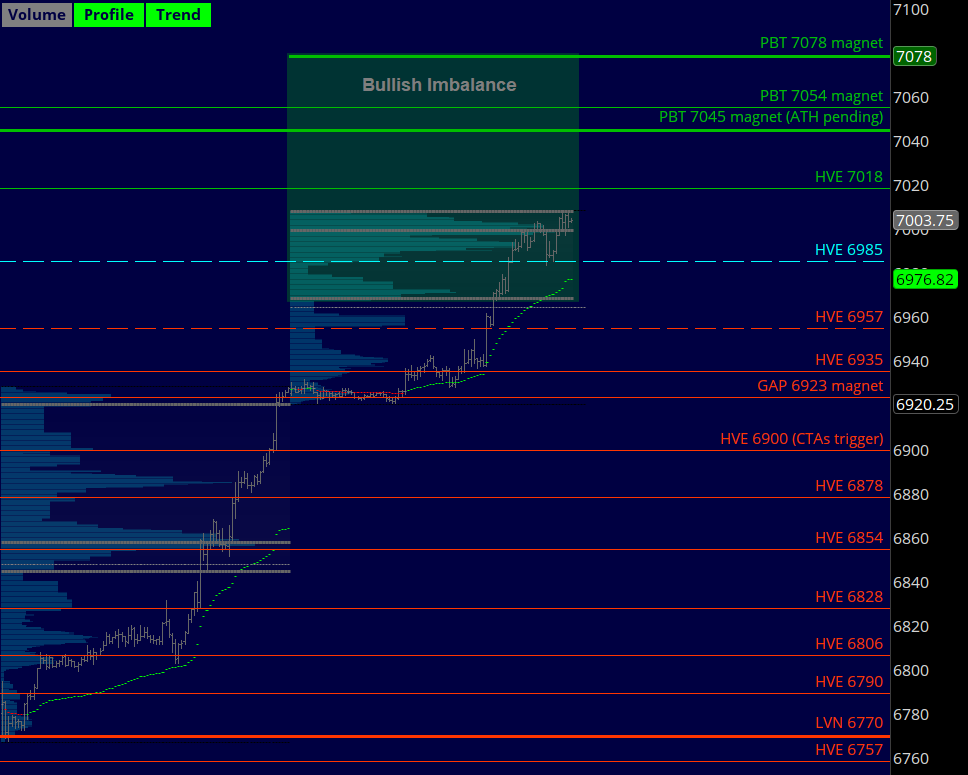
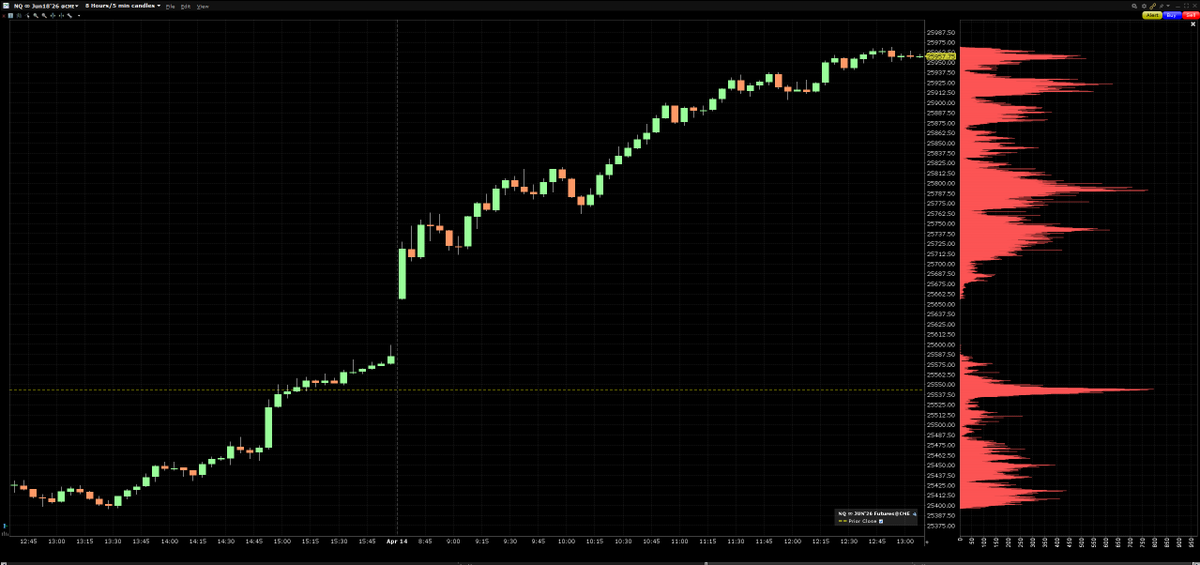
Price is extended from value area
Lack of fresh volume above current highs
Mean reversion tendency toward 26125–26150 HVN
Typical auction behavior: price rotates back to value after extension
Expected behavior:
Initial rejection or stall at highs
Rotation down into nearest high-volume node
Possible consolidation before next move
🔺 Continuation Probability: 25–35%
Why lower:
Continuation requires new aggressive buyers
Current structure shows diminishing momentum near highs
No clear breakout + acceptance above current range yet
Continuation scenario requires:
Holding above ~26190–26200
Increasing volume at highs
Tight consolidation (bull flag behavior)
Quant Bias NQ
ScenarioProbability
Bull continuation60%
Range around mean28%
Sharp selloff12%
NEW EOD accounts at DayTraders
SALE 85% OFF
code: UXBNDGBR
https://t.co/dt90d4Nx9h
#VIX#ES_F#NQ_F