Worauf sollte man beim Gestalten eines BI-Reports achten? Mein Kollege @TorKraft und ich haben die wichtigsten Best Practices in einem interaktivem #Tableau Dashboard zusammengefasst🤓
#Datenvisualisierung @cimtag
#datafam#dataviz
https://t.co/CqBjStLxr2
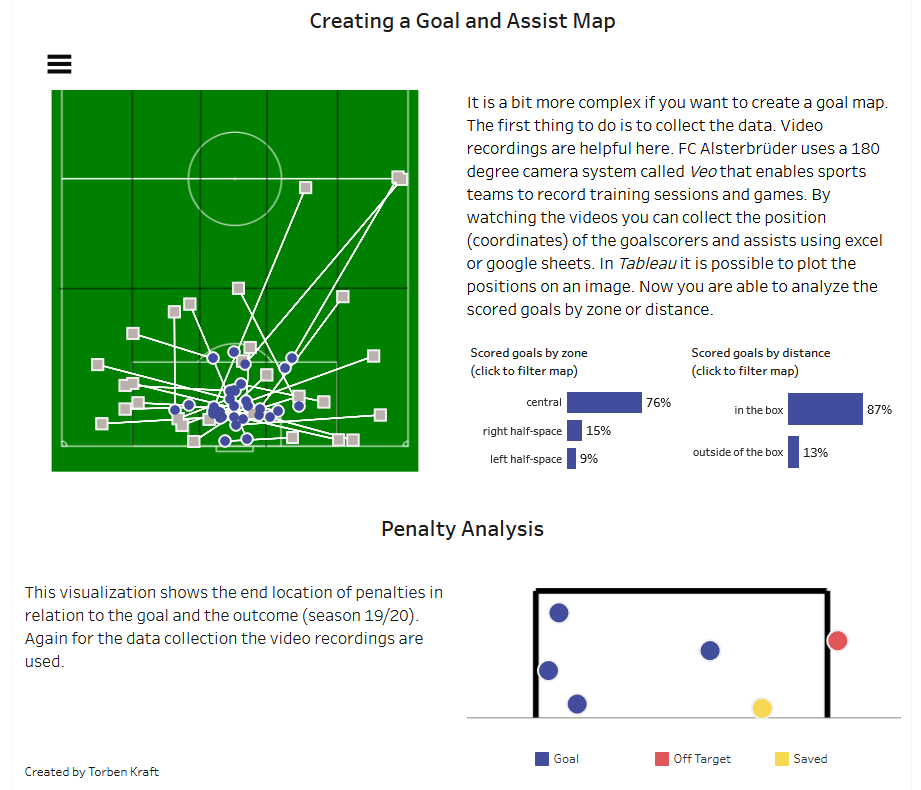
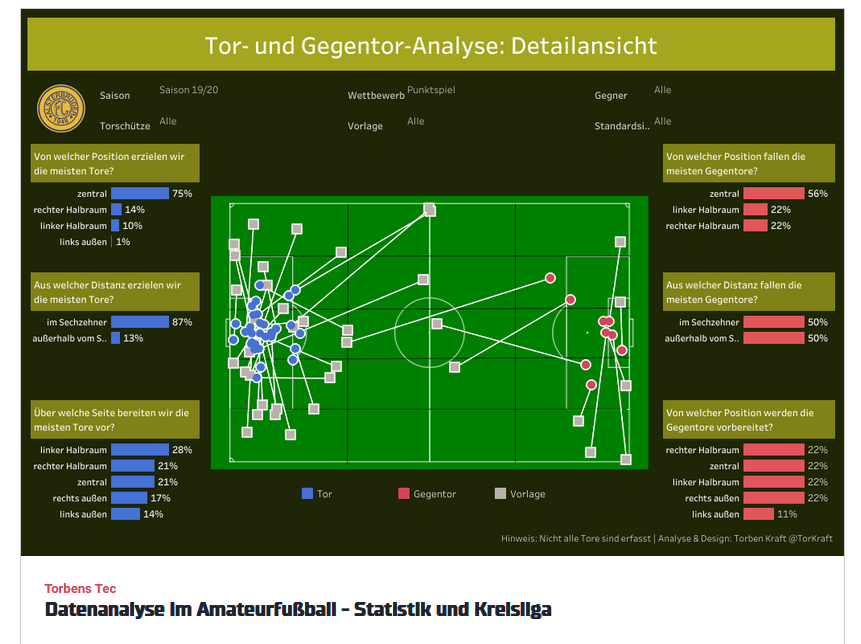
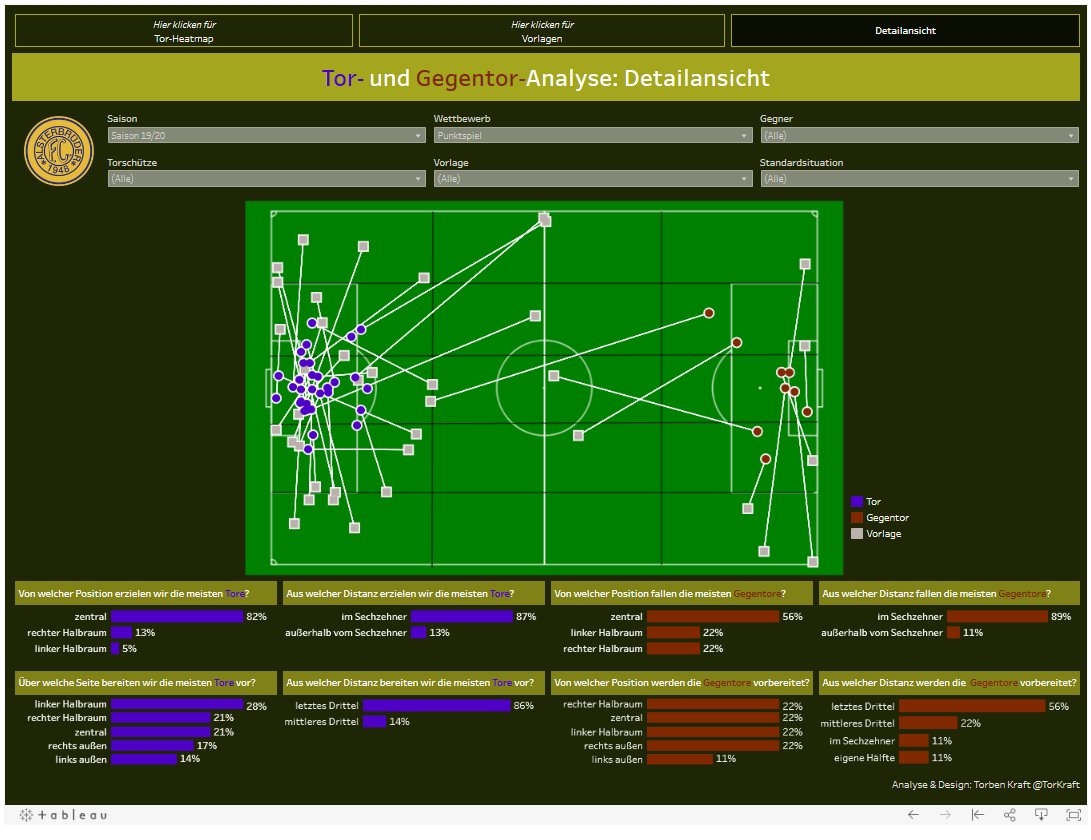
Two things I am passionate about: playing football and data visualization. So here is my entry for #IronQuest: How to use data in amateur football.
Thanks @sarahlovesdata for the great theme!
@tableaupublic@alsterbrueder
https://t.co/fUYk5KWzqZ
Buffer calculations in @tableau do an incredible job of showing the problem with the Mercator Projection. This buffer calculation is showing 1000 km at all times! This is insane. Comments from @mapsOverlord or @AdiBop_ ?
📣New Viz! There are 14 eight-thousanders around the world and only one is still not summited in a winter - K2. 10 of other first winter ascents were made by Polish climbers.
Explore geography and first ascents!
▶️https://t.co/xVYT9smrFQ
#Himalayas#mountains#Tableau#dataviz
#30DayMapChallenge
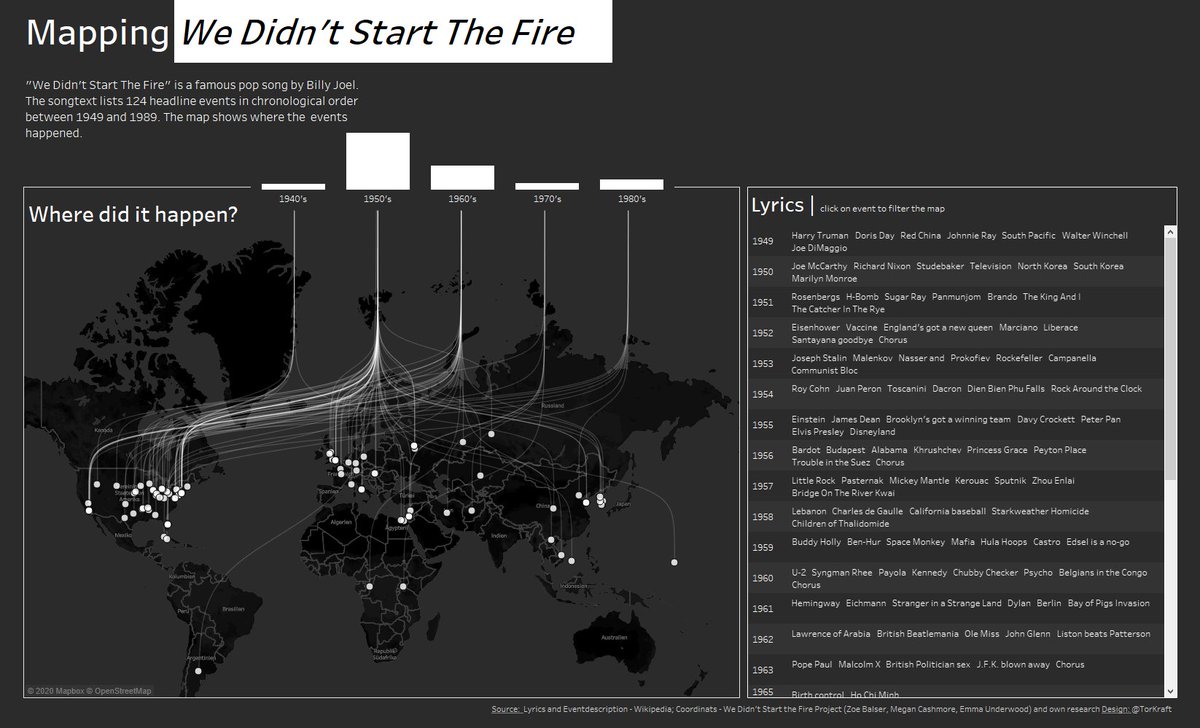
Day 09 - #Monochrome
Mapping of the events mentioned in Billy Joel's song "We didn't start the fire"
Made with @tableaupublic
Interactive version: https://t.co/vMV0IJsh8R
Dustin Böttger gehört mit seiner Firma Global Soccer Networks zu den führenden Kräften in Sachen Datenscouting und berät Vereine wie Manchester City, Inter Mailand und Paris Saint-Germain. Im Gespräch mit TM gibt er interessante Einblicke in seine Arbeit. https://t.co/vMQDmOCQNf