💫Medium Term Trend Directions
$TOTAL: Score 0.07
Signal LONG🟢
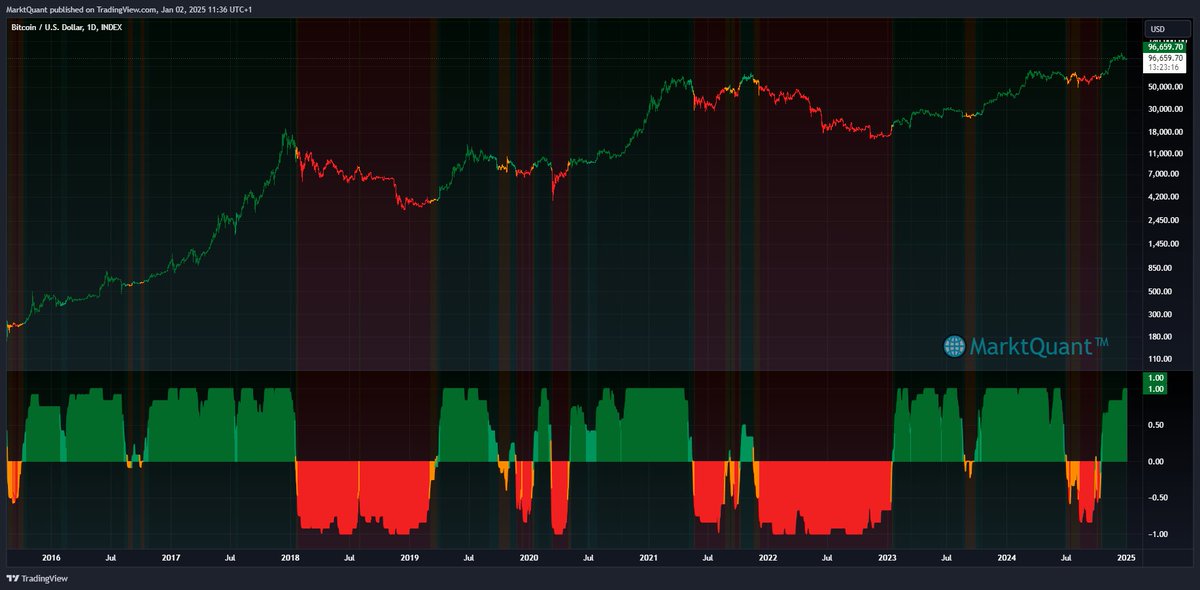
$BTC: Score 0.2
Signal LONG🟢
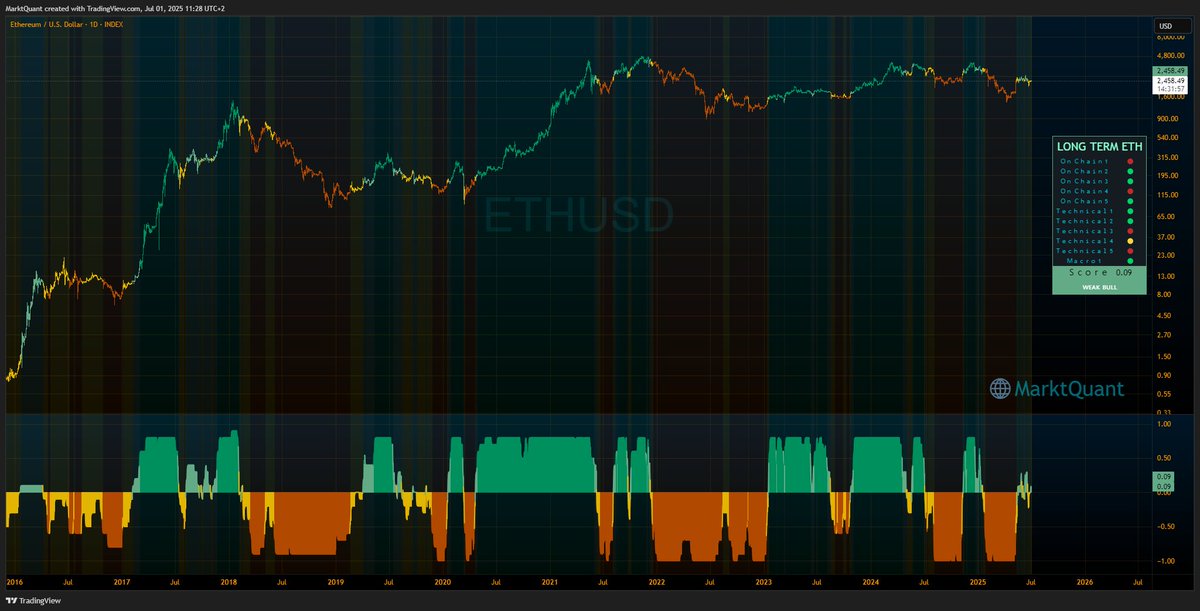
$ETH: Score -0.75
Signal SHORT🔴
$SOL: Score 0.43
Signal LONG🟢
$ETHBTC: Score -1
Signal SHORT🔴
$SOLBTC: Score 0.24
Signal LONG🟢
$SOLETH: Score 0.87
Signal LONG🟢
ALTCOINS: Score -0.81
Signal SHORT🔴
💫Medium Term Trend Directions
$TOTAL: Score-0.61
Signal SHORT🔴
$BTC: Score -0.6
Signal SHORT🔴
$ETH: Score -0.75
Signal SHORT🔴
$SOL: Score -0.84
Signal SHORT🔴
$ETHBTC: Score -1
Signal SHORT🔴
$SOLBTC: Score -0.91
Signal SHORT🔴
$SOLETH: Score 0.21
Signal LONG🟢
ALTCOINS: Score -0.78
Signal SHORT🔴
💫Medium Term Trend Directions
$TOTAL: Score-0.63
Signal SHORT🔴
$BTC: Score -0.74
Signal SHORT🔴
$ETH: Score -0.75
Signal SHORT🔴
$SOL: Score -0.86
Signal SHORT🔴
$ETHBTC: Score -1
Signal SHORT🔴
$SOLBTC: Score -0.97
Signal SHORT🔴
$SOLETH: Score -0.9
Signal SHORT🔴
ALTCOINS: Score -0.67
Signal SHORT🔴
📈Futures Data : CVD
Both CVD🔵Spot and CVD🔴Futures are experiencing a notable downward trend. Futures have declined📉 by -585%, while spot has dropped📉 by -336%.
This indicates a significantly stronger selling pressure driven by forced futures liquidations compared to spot activity.
The size of the CVD🔴Futures decline is nearly double that of the 🔵Spot CVD, reflecting the heavier impact in the futures market.
At present, no divergences have been observed in these metrics.
🤔 So what's going on with global M2, the four-year cycle and the dollar, and what does it all mean for asset prices?
M2 money supply is continuing to expand globally.
The latest data show the nominal stock of M2 money is rising across most international currencies, including the five largest (USD 🟢, CNY 🔴, EUR 🔵, JPY ⚪️, GBP 🟡).
The supply of these currencies has generally been rising since at least late 2023.
The euro and the dollar in particular are currently growing at a faster pace than they were pre-pandemic.
However, the strong US dollar is still weighing heavily on dollar-denominated global M2 money supply measures.
This is because the dollar has recently been increasing in value at a faster percentage pace than the money supply of other global currencies is increasing.
While you can play with the Y-axis to show whatever you'd like, I think it's clear there's currently a disconnect between global M2 and the price of assets like US stock indices and bitcoin.
To be confident of a sustained risk asset bull market in 2025, I would ideally like to see this dollar-denominated global M2 measure rising.
It's all about the denominator
So, this latest downleg over the past three months for dollar-denominated global M2 measures is not "global money contracting".
It is solely a "denominator technicality".
But it's still important.
Here's my thoughts:
1⃣ It needs to be denominated in something, and the dollar makes the most sense, because the vast majority of people using these measures are doing so to compare against the value of assets, which they are also denominating in dollars.
2⃣ The dollar appreciating against other currencies is a problem for "global liquidity" as a whole because:
⏺️ More than 50% of world trade is denominated in dollars
⏺️ More than 50% of global debt is denominated in dollars
So, if the dollar is strengthening rapidly against other currencies, servicing debt and conducting trade saps more and more liquidity globally, consequently leaving less available to put to work in asset markets.
This is why the dollar weakening is one of my key themes for 2025.
Should it weaken a lot - we could see dollar-denominated global M2 measures increase significantly.
But if the dollar doesn't weaken, or even strengthens further - it will be a very tough ask for any significant dollar-denominated global M2 increase.
Over the past eight years, more than 95% of the increase in dollar-denominated global M2 money supply has coincided with four relatively short periods of dollar index (DXY) weakness:
The four-year cycle
For the past 14 years, global M2 measures have generally followed a loose 4-year cycle, coinciding with bitcoin cycles (average length of 1507 days from trough to trough).
Many people are pinning their hopes on a repeat.
But so far, this cycle has been lackluster at best - lagging behind previous cycles.
I think it's likely the nominal stock of M2 money across global currencies will continue to increase at a decent enough pace through 2025 as the worldwide rate cutting cycle continues.
However, to see a dollar-denominated global M2 increase at a similar scale to 2017 or 2020, it's likely that the dollar must weaken a lot.
Using the dollar index (DXY) as a measuring stick, I'd estimate that DXY must weaken down to at least 100 and probably lower (-8%+ from current levels) to see a cycle anywhere near the scale of previous cycles.
The dollar is the most important thing to watch heading into 2025.
🔥Liquidation Heatmaps
$BTC
Short liquidations are steadily building between $102K and $104K, indicating potential resistance above. Meanwhile, resting long liquidations remain visible in the $90K to $94K range below, highlighting downside vulnerability should momentum reverse.
$ETH
ETH exhibits liquidation clusters below the current price, extending down to $3.2K, while short liquidations are resting at $3.8K above. The current price action could suggest the formation of a local bottom, contingent on the broader market dynamics.
$SOL
SOL's long liquidations are concentrated below, spanning $185 to $190, with higher-level long liquidations observed around $230. This setup suggests that SOL may be approaching a bottom, assuming market conditions stabilize.
Dollar Strength, Liquidity Weakness
China🇨🇳's recent monetary policy shifts aim to bolster long-term economic stability but come with short-term hurdles.
The transition to a "moderately loose" stance, coupled with strategic rate cuts, reflects efforts to stabilize amidst global challenges. Yet, these small steps may fall short without bolder action.
In the US, the TGA has dipped below $700 billion and could decline further as debt ceiling debates drag on. Meanwhile, the MOVE Index signals a temporary calm in bond market volatility.
Central banks, including the Federal Reserve, remain cautious, holding off on significant liquidity injections. The DXY weakened today following rumors of a universal tariff plan, which would be applied to only certain sectors, by Trump - only to partially rebound after he dismissed the claims as "fake news."
Still, the narrative hints at a strategic use of dollar strength in trade negotiations and likely, its strength will "disappear" post-inauguration, when a bunch of deals are already set in place.
This potential "bluff" tactic could very well lead to a bullish environment for risk assets.
Our Global Liquidity Index declined by $0.613T this week, representing a 0.48% drop.
Liquidity momentum remains weak, with the 3-month rate of change still trailing the 12-month rate of change.
💎Buy and Hodl vs. 📈Strategy
Here are the metrics (starting from 1/1/2018) for $BTC using the MarktQuants Supertrend indicator I shared earlier.
Backtesting is important in investing
It’s the foundation of knowing your system’s performance, optimal settings, and many more crucial data.
Without quantitative data, initial impressions can be misleading, making thorough testing a non-negotiable step for informed decision-making.
Liquidity, Yields, and the DXY
China's🇨🇳 Liquidity Moves:
The People's Bank of China (PBoC) injected RMB 580.2 billion last week via reverse repo operations at a fixed rate of 1.50%. While this provides short-term relief, it follows aggressive prior liquidity drains. With global liquidity deteriorating and the Chinese🇨🇳 economy under pressure, these actions hint at potential stronger measures in 2025, especially if the DXY weakens and the FED eases policies.
US Liquidity Moves
The Treasury General Account (TGA) declined by $104.165 billion last week. As EOY financial conditions tighten, due to institutional balance sheet adjustments, this TGA drawdown offers short-term relief to funding markets.
However, with QT and elevated SOFR rates still exerting pressure, the broader liquidity environment remains tight, making sustained TGA drawdowns critical for any meaningful liquidity improvement in early 2025.
As highlighted in our recent post, it is necessary for the FED to start QE measures to address the debt problem in the US.
DXY and Yields:
The DXY reached a 2-year high as demand for the USD surges amid tariff speculations. Meanwhile, bond yields continue rising despite rate cuts since September, signaling inflationary concerns for 2025. Both trends pose significant challenges to global liquidity conditions.
Global Liquidity Trends:
Our Global Liquidity Index declined by $0.52t, a -0.4% drop this week. Liquidity momentum remains weak, with the 3-month rate of change still below the 12-month rate of change.
Overall, the 2025 presents formidable challenges for global liquidity. Significant policy shifts, particularly QE from the FED, may be needed to address rising debt and stabilize liquidity conditions.