Jev-as-a-judge is available at TraceRoot now!
- Introduce Jev as one of the models supported in our BYOK offering
- Run Jev on production agent traces with 100x cheaper and 100x faster @typesafeai model
https://t.co/3O4YMMERDV
6/ Try for yourself, then tell us what it found and anywhere the CLI got in its way.
The trace viewer is for looking. The work happens where the code is. Put the trace there, and let the agent that already lives there read it.
1/ TraceRoot CLI: talk to your traces from your coding agent
Imagine this: A run went wrong in production at 14:12. The trace viewer shows 31 spans, 5 of them red, and the person who can fix it is in a Claude Code session with the repo open, not in a browser tab.
That gap is where most of the time goes. The evidence lives in the observability tool. The change happens in the editor. Someone carries the evidence across by hand, one span at a time, usually from memory, and by the time it arrives it is a paraphrase.
5/ We built the CLI as much for the agent in your terminal as for you. Point it at your recent traffic and see what comes back: the errors, the hallucinations, the runs that were slow and expensive.
Here's a full implementation and workflow:
https://t.co/PLgOOVSmSe
Your traces, organized your way
https://t.co/XVkvp9ppVP (YC S25) now lets you tag traces with your own metadata — then slice by it.
→ filter traces by any metadata key
→ choose which columns the trace list shows (incl. a metadata column)
→ filter builder auto-suggests your keys
Find the exact runs you care about, fast.
Try it → https://t.co/25lSERVX1j
https://t.co/XVkvp9ppVP (YC S25) now has dashboards for AI agents 📊
Traces for deep dives; dashboards for the big picture — latency, cost, tokens, error rate over time.
→ live-preview widget builder
→ time-series charts, any range
→ every row clicks through to the actual trace
CLI access coming soon 🖥️
👉 https://t.co/25lSERVX1j
Your coding agent can now check on your production agents 🤖
Want to see how your agents are doing in prod without switching to a dashboard? Stay in your terminal — we built @TracerootAI CLI
→ traceroot traces list — latest prod traces, any time range
→ traceroot traces get <id> — full trace tree, errors & I/O inline
→ traceroot traces export <id> — dump the bundle, hand it to Claude Code / Codex / Cursor to debug
Best part: no commands to memorize. Just describe what you want in plain English and your coding agent runs it for you.
👉 https://t.co/6AVThcpHsY
Advanced trace filtering is live in @TracerootAI 🚀
Thousands of agent traces → the handful that matter, in a couple clicks:
- filter any field with explicit operators (=, ≥, ≤)
- filter by trace_id
- URL-synced, so you can share or bookmark a filtered view
It took us a bit longer than we first expected to get basic filtering done properly — but it's worth getting this right, since some things still look much nicer and more convenient in a dashboard than a terminal or Slack channel~ 👀
👉 https://t.co/25lSERVX1j
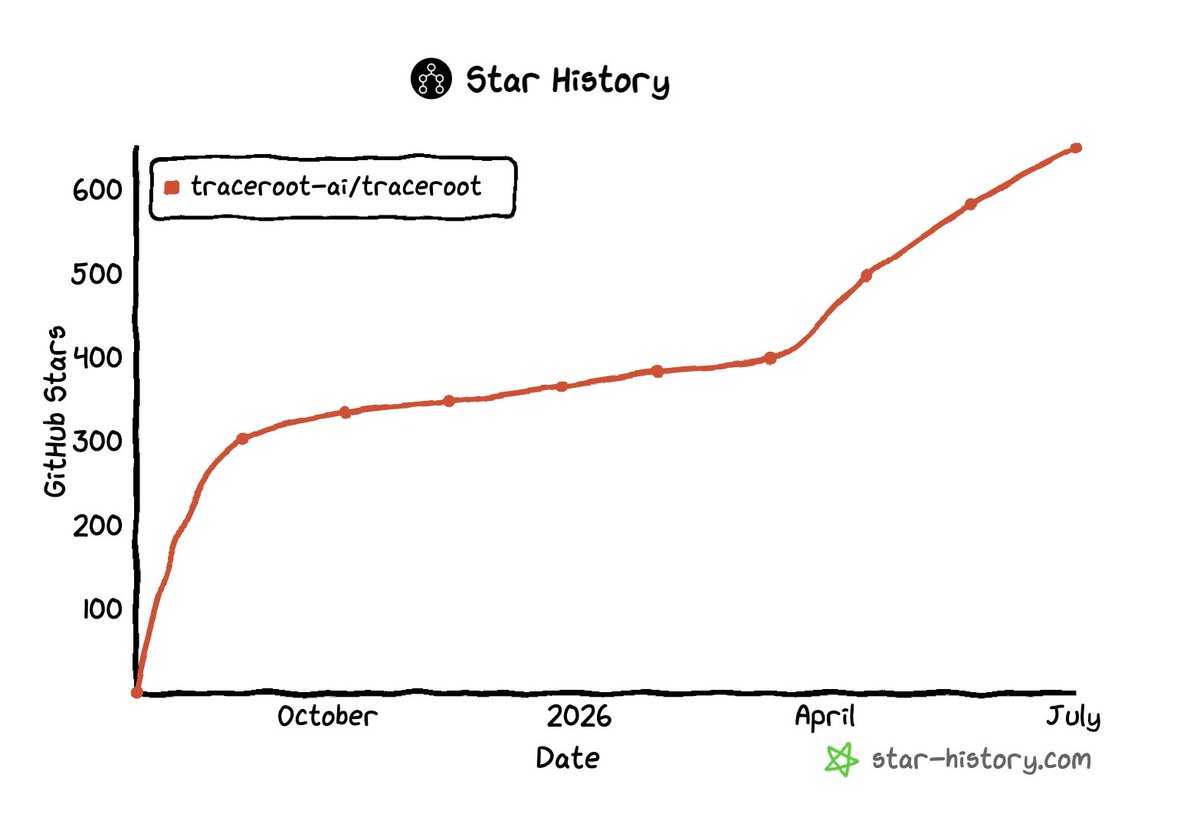
650⭐ on GitHub for TraceRoot 🚀
The last few months have been something else - growth picking up fast, new contributors joining every week, 70k+ SDK downloads and climbing.
Open-source self-healing layer for AI agents, built in public.
Huge thanks to everyone shipping with us 🙏 we're just getting started!
@TracerootAI v0.3.1 is out 🚀
- New: Microsoft Agent Framework integration
- Faster trace queries + hardened infra
- Public API upgrades & lots of polish
More features coming very soon~
https://t.co/RZFZBPiE9w
Your trace shows what broke. Our AI agent tells you why — by reading your actual code. 🔍
Connect GitHub, click "AI Assistant" on any trace → it clones the exact repo version that ran, finds the failing line, and traces it to the commit that broke it.
👉 https://t.co/25lSERVX1j
@TracerootAI v0.3.0 is out 🚀
A ton shipped since our last release:
- Rebuilt trace UI — color-coded spans, fullscreen, open-in-new-tab, resizable panels, timeline view
- Live trace streaming (SSE) — watch agent runs in real time
- Inline images & audio — media renders right in the trace viewer
- Cost, tokens & latency everywhere — cache + reasoning breakdown, per-span cost
- Huge traces load instantly — gzip, virtualized tree, ClickHouse rebuild
- 20+ framework integrations — OpenAI Agents, Claude Agent SDK, Pydantic AI, CrewAI, AutoGen, LlamaIndex, Vercel AI SDK, Bedrock, etc.
- New models — GPT-5.5, Gemini 3.5, Opus 4.8, DeepSeek V4, Kimi K2.6, GLM-5.2
Full notes 👇
https://t.co/J2Z5g75Rpj
Huge thanks to all the contributors! 🫶
@TracerootAI now traces @pydantic AI agents, end to end 🐍
Customers asked — so we shipped it.
- One-line auto-instrument: `traceroot.initialize(integrations=[Integration.PYDANTIC_AI])` — every agent run, LLM call & tool call. No decorators.
- Accurate cost & tokens, cache included
- A working example to copy: https://t.co/5Th3tMplIU
👉 pip install traceroot
GLM-5.2 is built for agentic work — frontier coding, open weights, 1M context. 🔥
So we support it in the coolest part of TraceRoot: a self-healing layer for AI agents.
A production coding ai agent, could run on GLM-5.2 with your API key, that watches your agent system in production 24/7, catches failures, find the root cause, and tells you exactly how to fix them.
Freshly supported by our OSS contributors 👇
https://t.co/bT3vey2m6A
thanks @internetDevv and @lqiu03 !
One real customer trace: 67 spans, 24MB. A single lookup scanned 1.59 GiB and took ~3s.
AI agents only get bigger. If your observability can't load that fast, it fails you exactly when you need it most.
So we rebuilt how TraceRoot loads large traces 🧵
Vercel just went all-in on agents this week ▲
If you're building on the AI SDK, here's how to actually see what your agents do:
TraceRoot shipped first-class AI SDK v6 examples — full traces, every tool call, and real cost (cache tokens broken out).
👉 `npm install @traceroot-ai/traceroot`