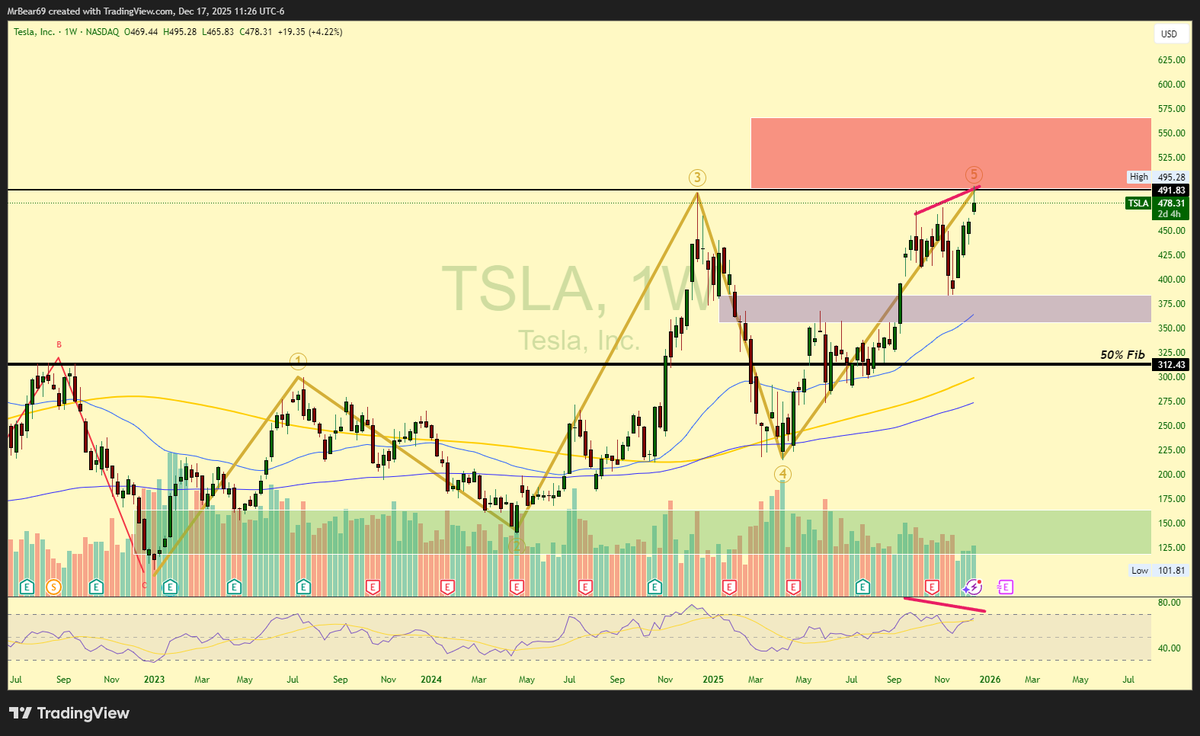
$TSLA
9 months ago I mapped the bottom and the path to $490+.
Price just followed the map step by step.
Charts don’t predict they expose probabilities.
Trading term of the day: Short Squeeze.
Some traders bet a stock goes down. They borrow shares, sell them, and plan to buy them back cheaper later.
Now the stock goes up instead. Their losses grow fast. Some get forced to buy shares back just to get out.
That buying pushes price higher. Which forces more shorts to buy. That loop is the squeeze.
Imagine a stock where 30% of the float is sold short. Good news hits. Price jumps, and the shorts scramble for the exit.
Why it matters to you: squeezes are fast and violent. Chase one in the middle and you may be buying the top.
Members ask about this one in the group all the time.
Shorts don't exit by choice. That's the whole engine.
$CDNS just beat AND raised, and the stock is up about 2% after hours.
Q3 EPS came in at $2.11 vs $2.04 expected. Revenue hit $1.63B vs $1.61B.
But look at the guide. Full year EPS now $8.37 to $8.43. The Street was at $8.16.
The guide beat by far more than the quarter did.
Record backlog of $8.2B, plus a new $2.5B buyback. Members in the group have been watching the AI chip design names, so this one matters.
Beat the quarter. Then beat the guide.
2 days into my hunting trip and already crashed twice lol.
I lost a mirror and my hand guard.
Who knew a 550 pound bike would slide out in loose rock and gravel.
$MRNA is down 7% to $185.74 today.
The melanoma vaccine hit its main goal. Shares still fell.
The distant spread results came in far smaller than the earlier study showed.
Meanwhile the biotech ETF $IBB is up 0.2% and $SPY is up 0.3%.
Winning the trial was not enough. The market wanted more. That is what one big bet looks like when expectations run ahead of the data.
We talk about this exact risk with single pipeline names in the group.
Price pays for the data it wanted, not the data it got.
2 days into my hunting trip and already crashed twice lol.
I lost a mirror and my hand guard.
Who knew a 550 pound bike would slide out in loose rock and gravel.
Trading term of the day: Short Squeeze.
A short squeeze is when traders betting against a stock are forced to buy it back, all at once.
Here is how it works. Short sellers borrow shares and sell them, hoping to buy back cheaper. If price rises instead, their losses grow fast. Stops get hit. Brokers force buybacks.
Every buyback is a buy order. That pushes price higher, which forces even more buybacks.
Imagine a stock with heavy short interest and a small float. Good news hits and price jumps 15%. The shorts have to cover. Buyers pile in on top of them. That is how a stock runs much further than anyone expected.
Members ask about this one in the group all the time. A squeeze is fuel, not a reason to buy. When the forced buying ends, price can fall just as fast.
Shorts don't pick when they exit. Price does.
Stocks opened red. The Dow is down 1.09%. The S&P 500 is down 0.4%. The Nasdaq is down 0.3%.
Thursday was the Nasdaq's worst day since June. The 10-year yield just had its biggest one-day drop in more than two years and sits back under 5%.
Money ran to bonds. The odds of an October Fed hike fell to about 5%, down from 37% at the end of September.
This is the kind of tape we track in the group. You can see who is selling and where the money is hiding.
Tech sells. Bonds catch the cash.
Everyone said $NBIS wouldn't pullback when we were in the $260 area. Now we are at $161 and only -24% left to the min target.
The average daily move for $NBIS recently has been -5% and sometimes -12%.
This can happen very quick.
A break below this trendline would send us to that $124 target easily and possible in the $80-$100 range.
This is true. There is almost always a bullish chart what matter the market. You must track the leaders and the index’s.
If the leaders show weakness like semis then those good setups will fail.
This is classic retail. Keep your head up and keep up the work.
Funny to bleed followers every day despite nailing macro analysis.
I assume it is due to the failure of many setups that once promised upside in June, but were invalidated since due to an unprecedented unwind under the surface. Unfortunately, many only see upside potential and assume it’s guaranteed. I’ve stressed time and time again the importance of taking into account Bearish Divergence at local highs or invalidation levels during formation of a HL. Many of my long-form breakdowns and charts consider these, typically revolving around the .786 Fib/.886 Fib or a Log Fib S&R around them.
This year has not been one for smooth sailing. It requires aggression at opportune times with the ability to pull away when the tide shifts. A majority do not have this skill then look to cast blame elsewhere rather than looking inward and improving their own discipline or skill set.
Everyone said $NBIS wouldn't pullback when we were in the $260 area. Now we are at $161 and only -24% left to the min target.
The average daily move for $NBIS recently has been -5% and sometimes -12%.
This can happen very quick.
A break below this trendline would send us to that $124 target easily and possible in the $80-$100 range.
Trading term of the day: Consolidation.
Consolidation is when price stops trending and moves sideways in a tight range. Buyers and sellers are about even, so nobody wins yet.
Picture a stock that runs from $40 to $60, then spends two weeks stuck between $57 and $60. That is a pause, not a reversal. Big players are often loading up or unloading during it.
Why it matters to you: most small losses happen in here. Chop takes out stops on both sides. Then price picks a direction and leaves you behind.
Members ask about this one in the group a lot. The range is the map. The break tells you what comes next.
Boring ranges make the loud moves.
$META beat Q3 expectations and still closed down 6.98%.
Wall Street wanted more than a beat. Meta posted its first cash outflow in more than a decade from AI spending, then announced a 2-for-1 split with non-voting shares.
Same day, $BX closed up 8.37% on a better outlook for exits. The Nasdaq fell 2.60%.
We've been watching this in the group. The market is picking which AI bills it will pay for.
Price decides who gets the benefit of the doubt.
1) Yes this trendline is a possible turn around but won't be the bottom of the correction. The best case is we get sent to ATH from it but we will manipulate it and then head to the min target anyway if not lower. Very similar to what $ASTS did. This all depends if spy also breaks its trendline or we manipulate ATH as well.
2) Everything will get slaughtered. $WYFI is a speculative name thats already at all time lows. Back test what other smaller companies especially newly IPOs did in the 2022 correction. It was nasty.
$TSLA beat earnings and the stock still fell.
Adjusted EPS came in at $0.48 against $0.44 expected. Free cash flow hit $1.5 billion after burning $1.1 billion last quarter.
Revenue was $28.05 billion, a hair under the $28.13 billion estimate.
Shares dropped more than 3% in extended trading anyway.
This is why we watch the reaction in the group, not the headline.
The headline paid. The price didn't.