In this week's forecast I cover:
→ S&P 500 Fibonacci levels to watch
→ What the gap pattern means historically
→ Southwest Airlines trade recap (we hit the target 🎯)
→ A new stock showing a textbook setup right now
https://t.co/Cbutyv5QM6
The $VIX hit nearly 36 on Monday. Oil $BZ swung from $83 to $120 in a single session. And the $SPX logged three 1%+ drops in five days.
A lot of traders are scared. Here's what the charts are actually saying... 🧵
There's a rare overnight gap pattern that just showed up on the S&P 500. I've only seen it a handful of times. Every previous instance gave some specific signal about what came next...
Korea -19% in 3 days. Oil at $82 and climbing. S&P sitting in its longest squeeze since 2015.
A major airline just lost their fuel price protection — and the SEC filing is ugly.
Full market forecast + trade idea 👇
https://t.co/fqjmk60AIN
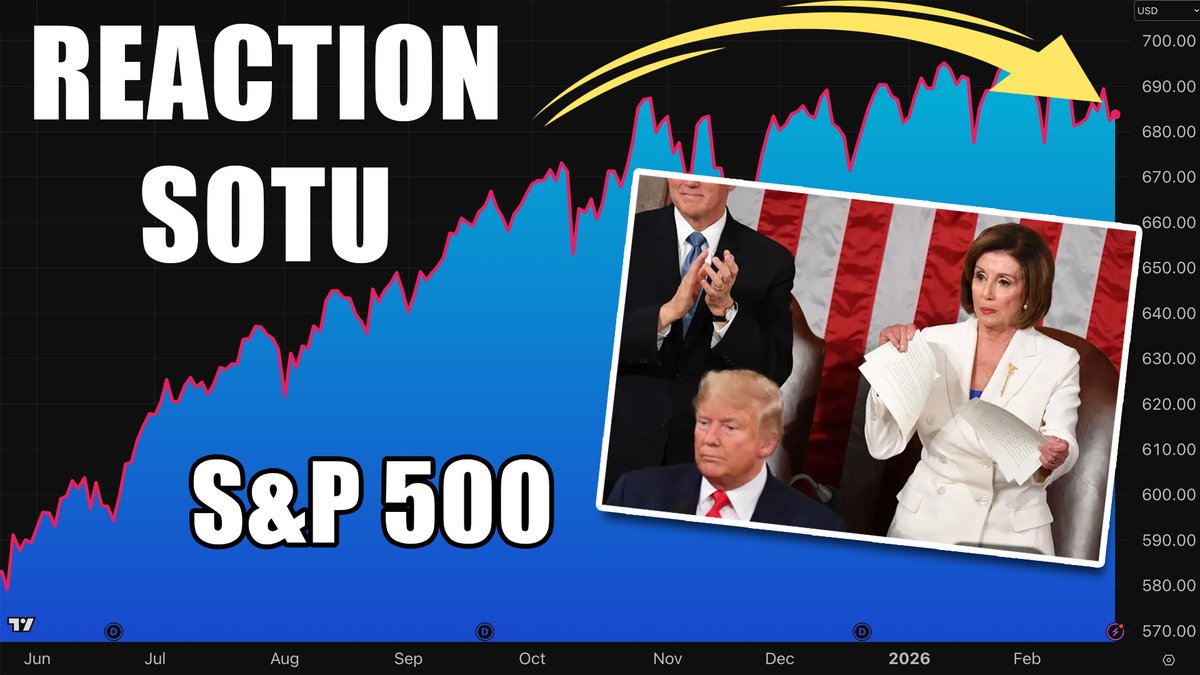
The $SPX hasn't been this coiled since 1966 — and tonight's State of the Union could be the catalyst that sets it off. 👀
I went back through 33 years of data to see what historically happens to the market after a State of the Union address. The results are hard to ignore.
Full Market Forecast Here: https://t.co/2IGzQC43g1
$SPY #SOTU #StateOfTheUnion #StockMarket #SP500 #TradingView #MarketForecast #SwingTrading #TradeSmart
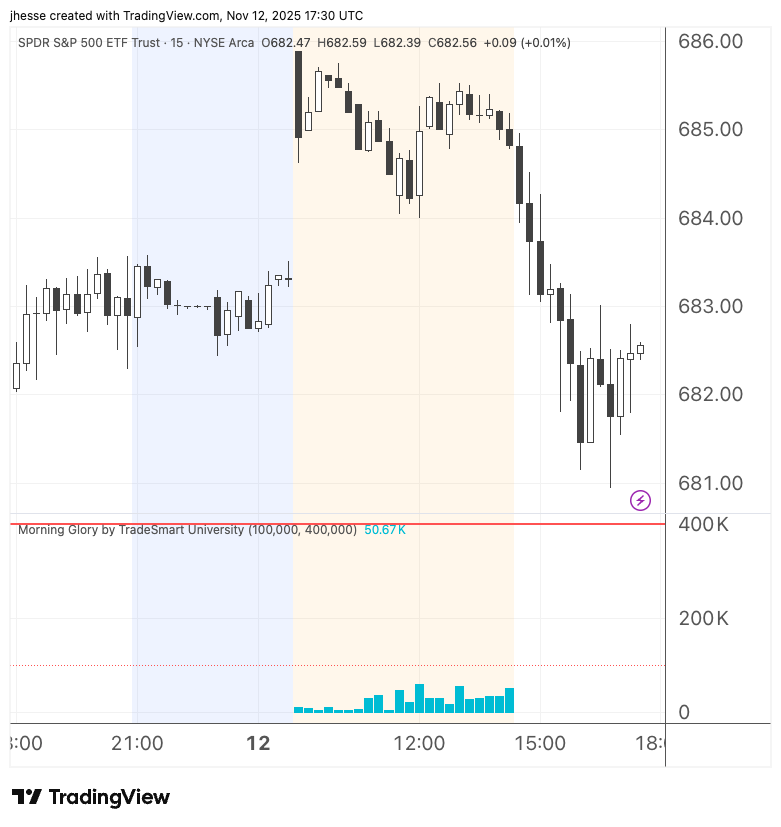
Low pre-market volume combined with a pre-determined overnight gap is a recipe for a beautiful "Morning Glory" 🤑 trade. This one was a layup!! (Blue shading is post market and orange shading is pre market.)
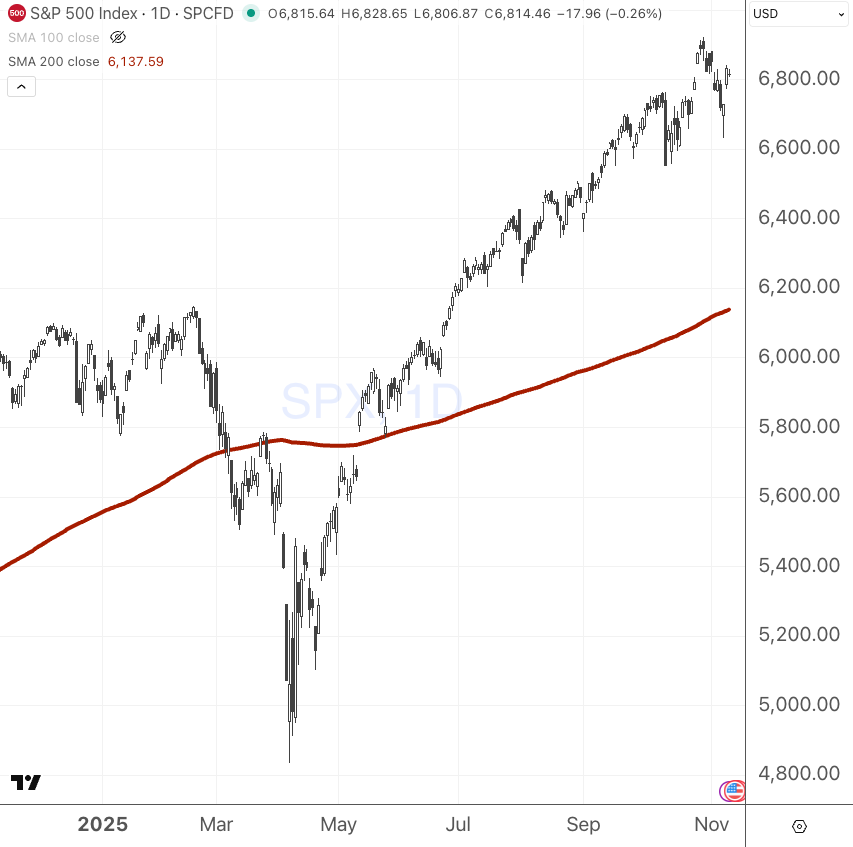
Watching the U.S. Dollar, 10Y Treasuries and Crude Oil - none of which have broken their down-trends. Money is staying in $SPY and the BULL run continues for now! Follow the money.
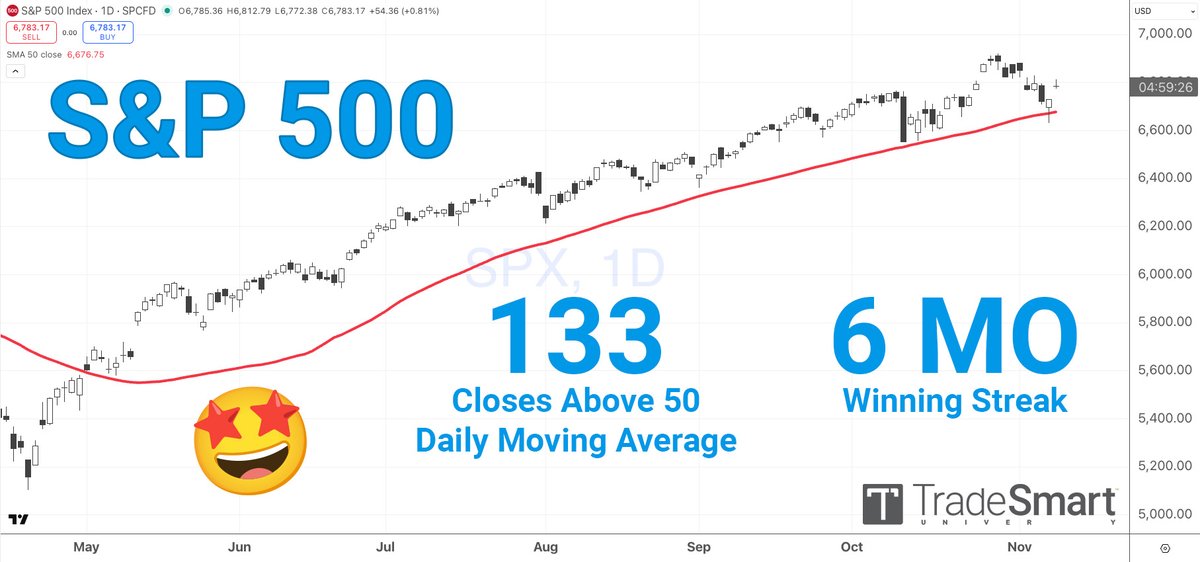
After last week's pull-back on $SPY, is the trend collapsing? History suggests NOT. While strong, this trend is not unprecedented. Don't trust the perma-bears!