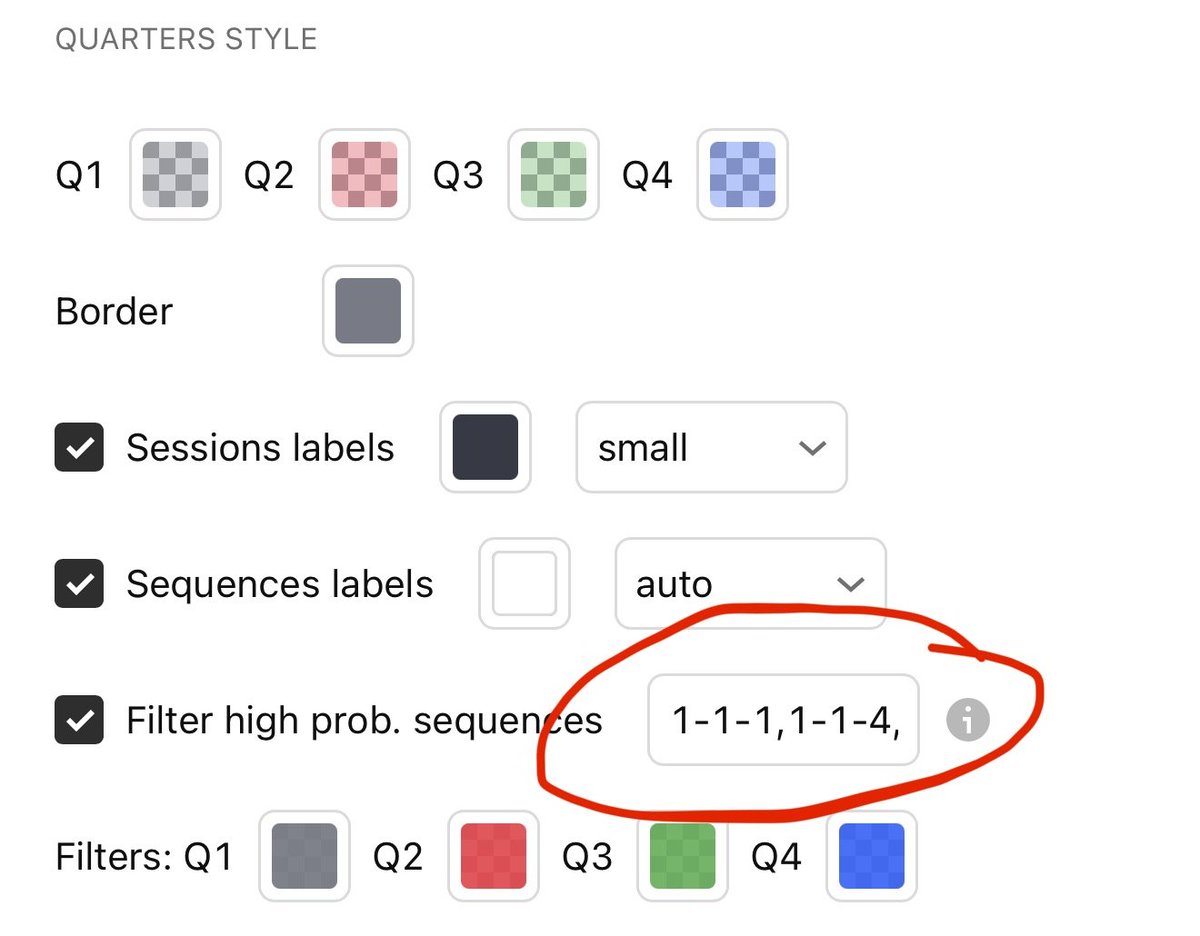
1-1-1,1-1-4,1-2-3,1-3-2,1-4-1,1-4-4,2-1-3,2-2-2,2-3-1,2-3-4,2-4-3,3-1-2,3-2-1,3-2-4,3-3-3,3-4-2,4-1-1,4-1-4,4-2-3,4-3-2,4-4-1,4-4-4
Paste these sequences into this box
Credit : @akjournal__
& @bharkethetrader
Indicator : @Shone1910
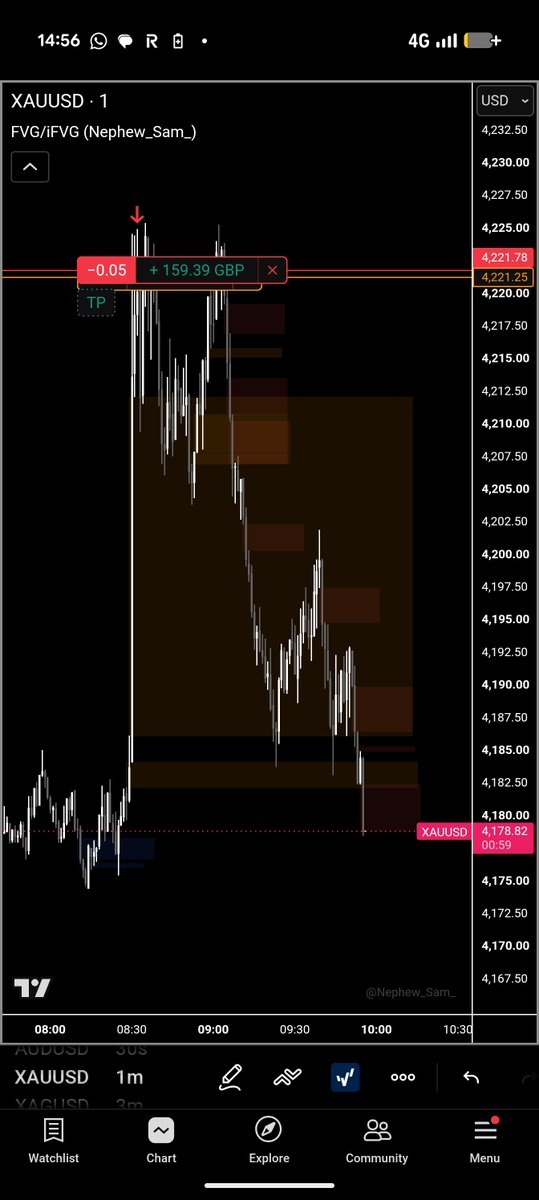
How I spot Distributions / Re-Distributions on $BTC
We know that marked ranges 70% of the time. So this means after every sharp move their will be range that gets formed.
A pattern that I have spotted on distributions or a re-distributions is following:
1) We have a sharp moved over a few days
2) VA forms with multiple untapped / equal lows
3) A fake out to the upside happens which takes out untouched highs / liquidity
4) Price breaks below VAH and moves quickly back below POC to VAL
5) Price fails to reclaim POC and starts grinding below the VAL
6) A sharp moved down happens in which all untapped lows get taken out
If you don't get model 1
Wait for model 2
If you don't get model 2
Wait for model 3
If you don't get model 3
Wait for model 4
If you don't get model 4
Come back tomorrow
And all of these models should agree with your model 5 framework
No model = no trade