Explore the Tags v2 tabs on TradesViz.
All the old bar charts have been removed.
Tags, tag groups (trade and day) are now first-class data items in TradesViz with full explorability.
This is just a short example 👇
Every chart, datapoint you see here can be explored 📊
Stop guessing what went wrong and let the AI Coach tell you exactly what to fix. ⚡
Get hard-hitting, actionable trading reviews the second you load up your main dashboard.
Find out exactly how much money you left on the table by missing your optimal End-Of-Day exits.
Double down on your most profitable setups while the system automatically calls out your revenge trading in real time.
Take the emotion out of your post-market review and execute based on hard math. 🚀
#TradesViz
Recreate complex market environments with the advanced Multi-Chart Trading Simulator. 📊
Run up to 4 fully synchronized charts simultaneously to backtest your multi-timeframe strategies. ⏱️
Load completely different symbols and trade them concurrently using independent order entry panels.
Toggle chart syncing or track the broader market while executing individual equities perfectly in stride.
Stop testing in a vacuum and start simulating real-world, multi-asset trading conditions. 🧠
Your entire trading day, beautifully organized on a single screen! ☀️
See exactly what major news events happened during your session right next to your specific trade logs. 📰
Easily customize the layout so your charts, personal notes, and watchlists are exactly where you want them. ✨
Make your daily journaling routine faster, easier, and a lot more insightful. 💡
A contradiction, or the ultimate goal most fail to reach?
We believe this still applies today.
In a world obsessed with quick fame and money, the true meaning of "value" often gets lost - especially in the markets.
When you look at your trading journey through the lens of your life goals: are you just extracting success, or are you striving to build lasting value?
What's your stance? Let us know below. 👇
Visualize your exact risk-to-reward parameters with the dynamic Options Payoff Charts. 📊
Model multi-leg strategies and instantly see your max profit and max loss zones.
Compare current pricing against expected value at expiration across different price levels.
Track individual leg Greeks including Delta, Theta, and Vega right below your curve.
Eliminate the guesswork from your derivatives trading and map your structural edge. 🧠
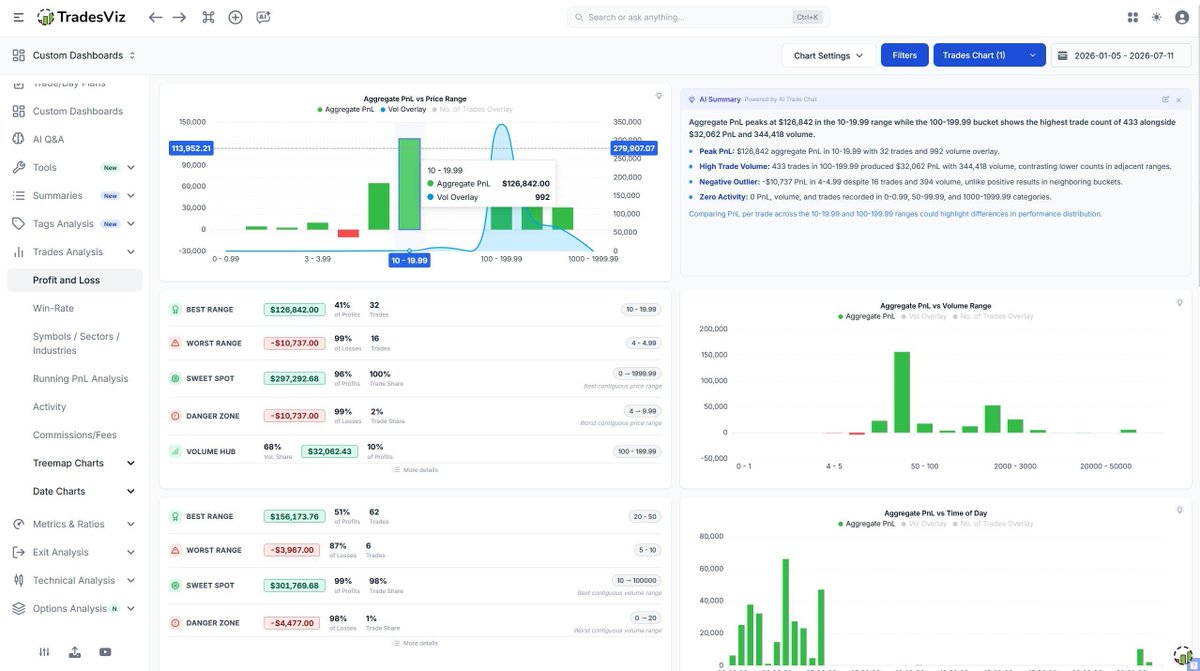
Find exactly where your trading system performs best and cut out the noise. ⚡
The Trades Analysis tab instantly highlights your most profitable price ranges and highest-performing volume hubs.
Stop bleeding capital in your designated "Danger Zones" and double down on the environments that actually pay.
Use interactive volume overlays to see exactly how much size you are pushing across different times of the day.
Let the AI-generated summaries do the heavy quantitative lifting while you focus on execution. 🚀
Interact directly with your trading history using the advanced AI Trade Chat. 🤖
Ask complex, natural-language questions to instantly summarize specific ticker performance. 📊
Generate deep narrative insights and structured data tables outlining your net PnL, average return, and trade counts.
Quickly dissect your options versus stock executions for any given symbol without building manual filters.
Let artificial intelligence run your post-market analysis and uncover your hidden edge. 🧠
Intraday trading is the hardest form of trading - treat it like an elite sport with @tradesviz 🧠
⚡ If you aren't practicing daily, you are just donating to someone else's account. Start putting in the reps here: https://t.co/Tv7Ihsxugk
Here is an exact guide to build a real edge using the multi-timeframe setup on TradesViz's multi-simulator:
1. Consolidate Your View: The multi-sim feature is the ONLY simulator built directly into a trading journal that lets you sim multiple symbols and timeframes in the exact same window.
2. Start Simple, Go Deep: Load up ONE symbol across multiple timeframes. Your goal is to learn to find patterns and correlations as the timeframes interact. Don't underestimate this - syncing multiple timeframes in your head takes immense cognitive effort.
3. Put in the Reps Daily: Do this every single day for 20-30 minutes. Focus entirely on that single symbol. To maximize your screen time, you can even crank the simulator up to 10x speed.
The Hard Truth: No amount of AI, algorithms, or magic indicators can do this for you. Real practice is what makes a real difference.
It is pure, manual effort and rigorous post-trade analysis that will translate into actual, profitable skill over the years.
Stop donating to the market. Put in the work. 📈💪
#DayTrading #TradingTips #PriceAction #TradingJournal
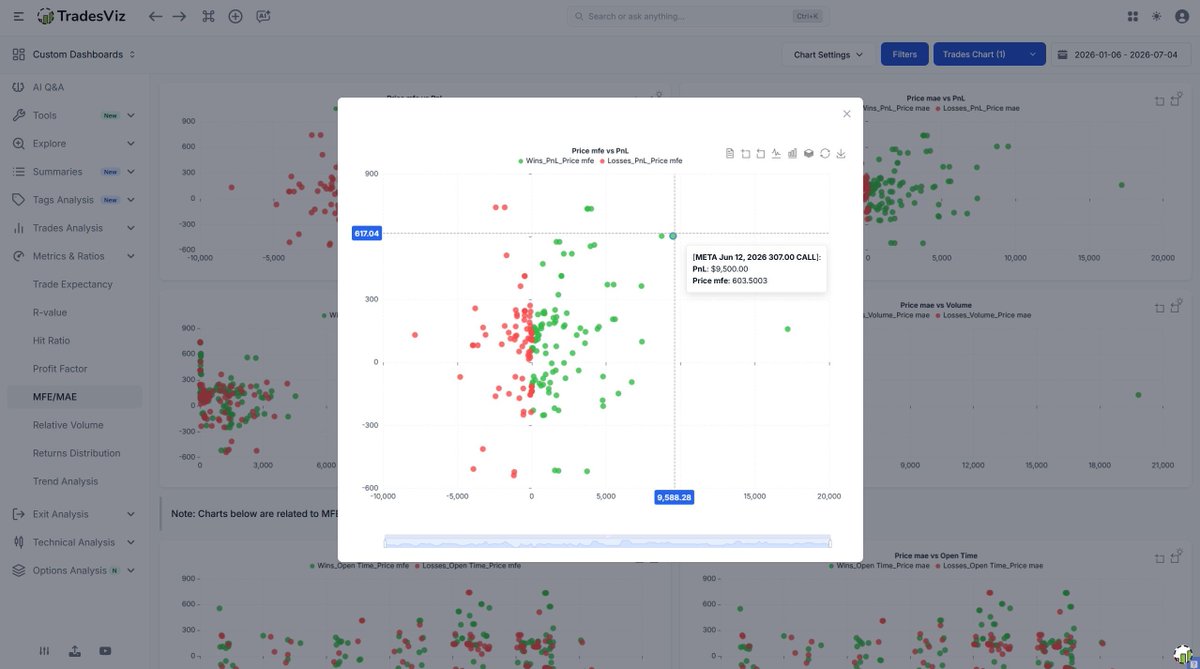
Visualize your exact trade efficiency with detailed MFE/MAE scatter plots. 📊
Instantly see if you are leaving money on the table or taking too much heat.
Expand any metric chart to inspect individual executions and price excursions.
Compare your Maximum Favorable Excursion directly against realized PnL.
Fine-tune your exits and optimize your risk management.
Get a complete macro view of your trading month with the Calendar Month View. 📅
Track your aggregate performance with built-in weekly summary columns on the right panel.
Identify at a glance which specific days of the week are yielding the best statistical results.
Stop relying on memory and let the hard data dictate your monthly reviews.
Log into Tradesviz right now!🧠
Stop wasting time writing complex filters and just ask your journal for the data you need. ⚡
AI Q&A transforms plain-text trading questions into structured performance charts instantly.
Type out exact parameters for execution times, specific weekdays, or custom account balances.
Review your calculated metrics in clean data tables alongside synchronized visual layouts.
Speed up your post-market research and let artificial intelligence crunch the numbers.
Want to look under the hood of the companies you are actually trading? 🏢
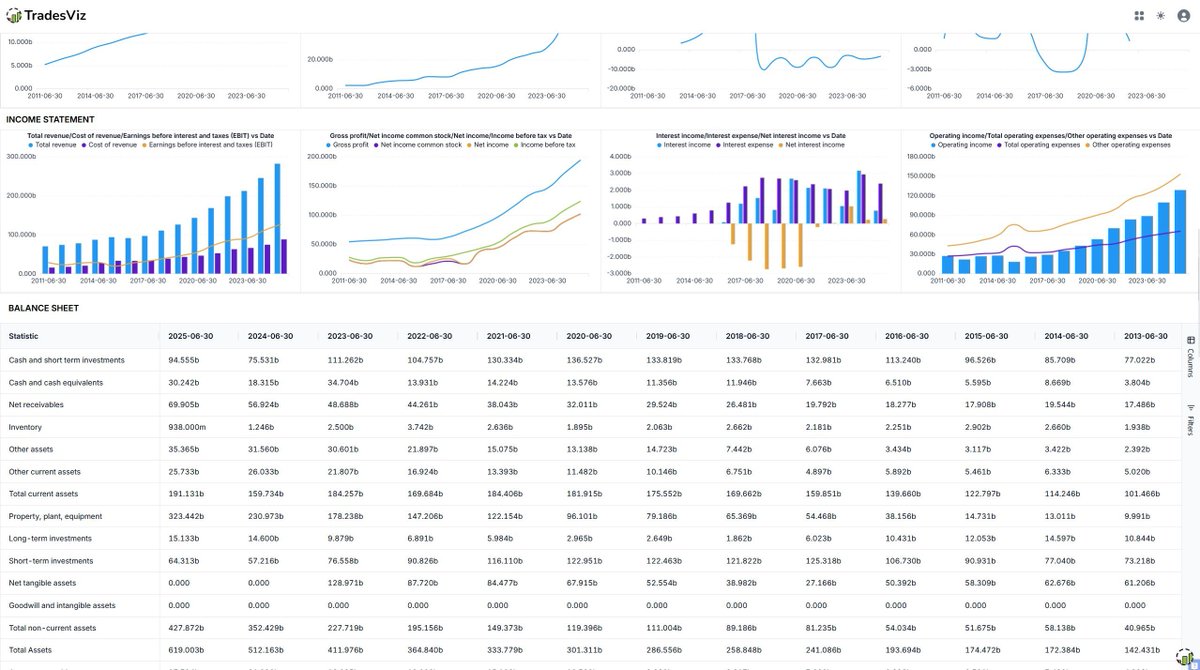
Fundamental Data tab gives you a clear view of a stock's long-term financial health.
Easily review yearly income statements, balance sheets, and total revenue growth over time.
Interactive charts make it incredibly simple to compare operating expenses and net income at a glance.
Bring fundamental analysis into your workflow without feeling overwhelmed by complex spreadsheets. 💡
Tired of staring at endless rows of raw numbers trying to spot a hidden trend? 😵💫
Spreadsheets are dead.
Visualize your performance instantly.
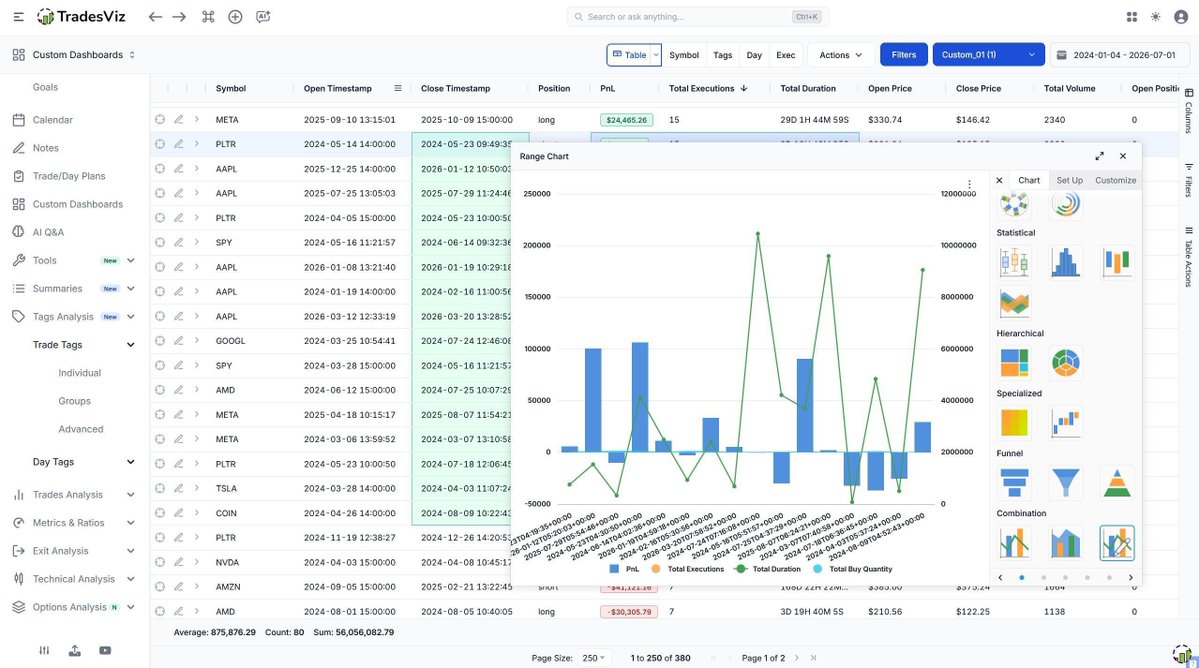
The interactive trades table lets you take your raw execution data and generate fully customizable pop-up charts on the fly
Seamlessly switch between statistical distributions, specialized funnels, or combination range charts without ever leaving your main ledger.
Stop digging through endless spreadsheets and let our AI do the heavy lifting for you. ⚡
AI Insights & Summary instantly generates a personalized briefing based on your actual executions.
Quickly identify exactly which setups are working and which ones are draining your account.
Get actionable advice on sizing, timing, and trade management before the market even opens.
Take control of your prep routine and attack the day with data-backed confidence. 🚀
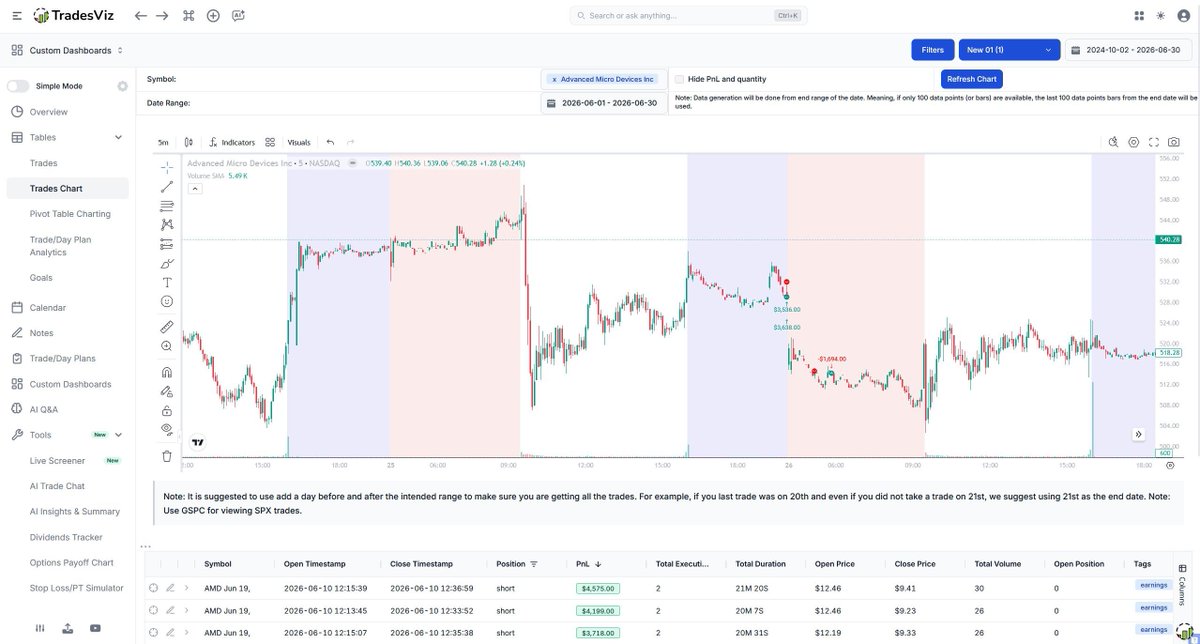
Review your exact execution timing directly on the chart with Trades Chart. 📊
Visualize your entries, exits, and realized PnL mapped perfectly to the historical price action.
Filter by specific symbols and custom date ranges to isolate and review your setups.
Keep all your granular execution data perfectly organized in the log right below the chart.
Stop guessing where you got filled and start reviewing with absolute precision. 🧠
TradesViz screeners are LIVE! 🟢
Have you checked the morning gappers today? 🌄
Not tracking a particular stock, but want to check it later?
Click on save snapshot and it's sent to your TradesViz notes :)
Review them later on.
Stocks breaking UP?... or DOWN?...
You analyze. Here's a short list.
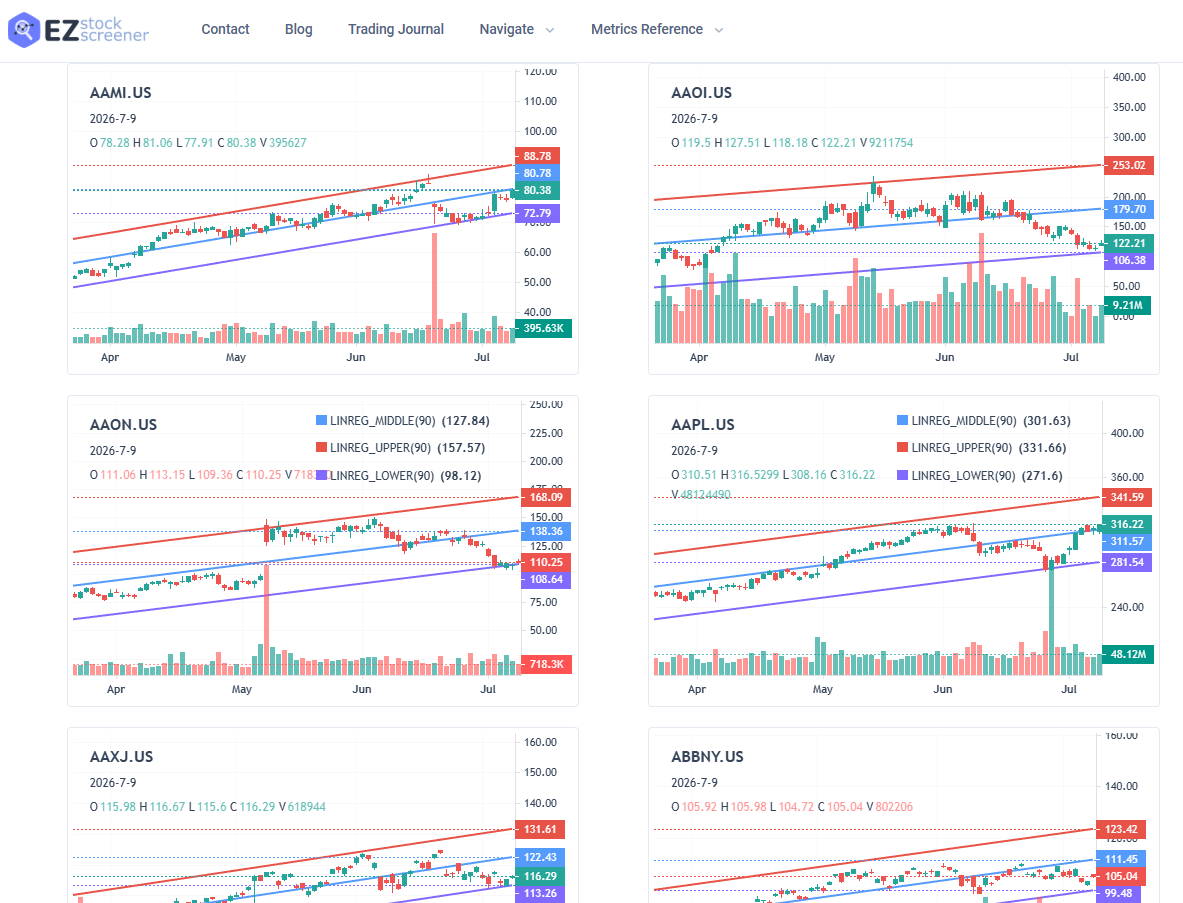
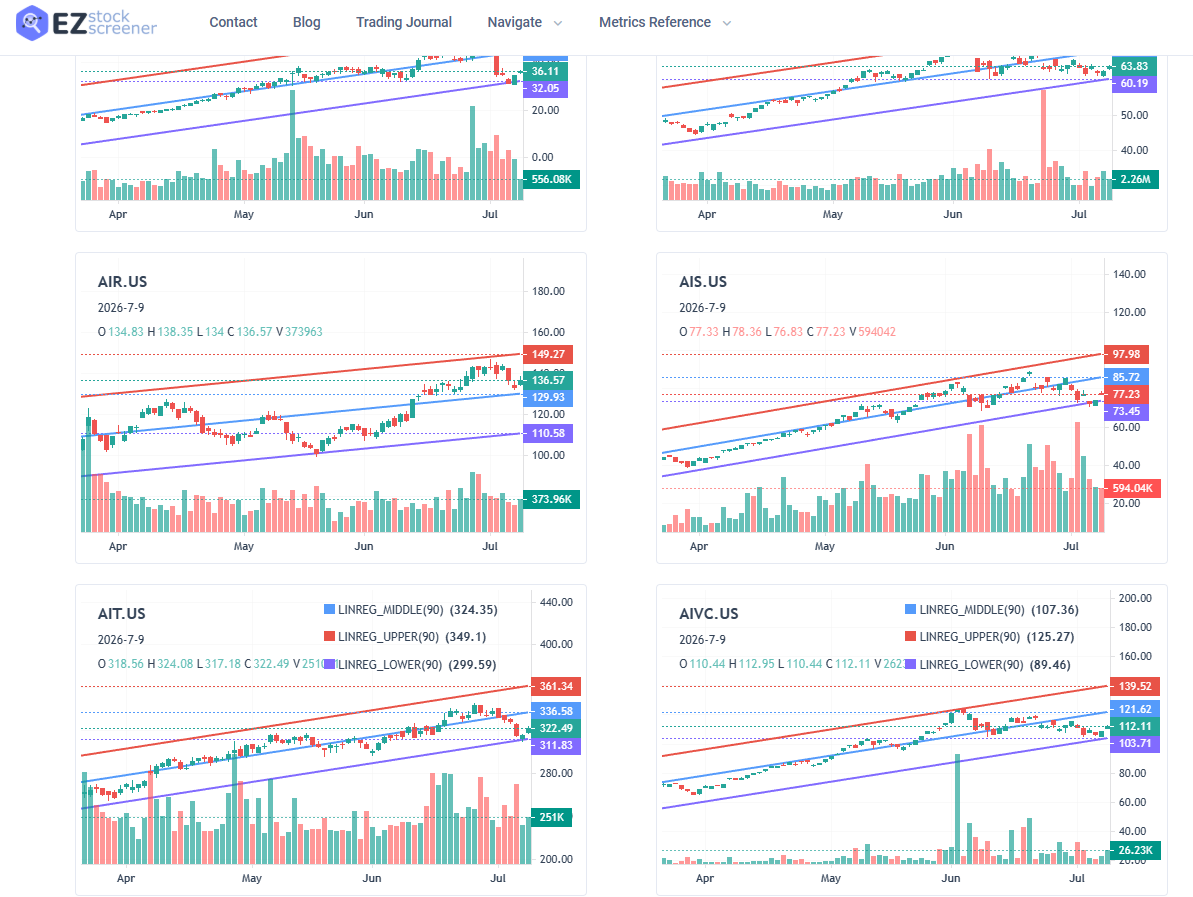
$AAMI $AAOI $AAON $AAXJ $ACLS $AIS $AIVC
Long-term linear trend screener results 👇
Check @tradesviz for LIVE screener + Options flow screening
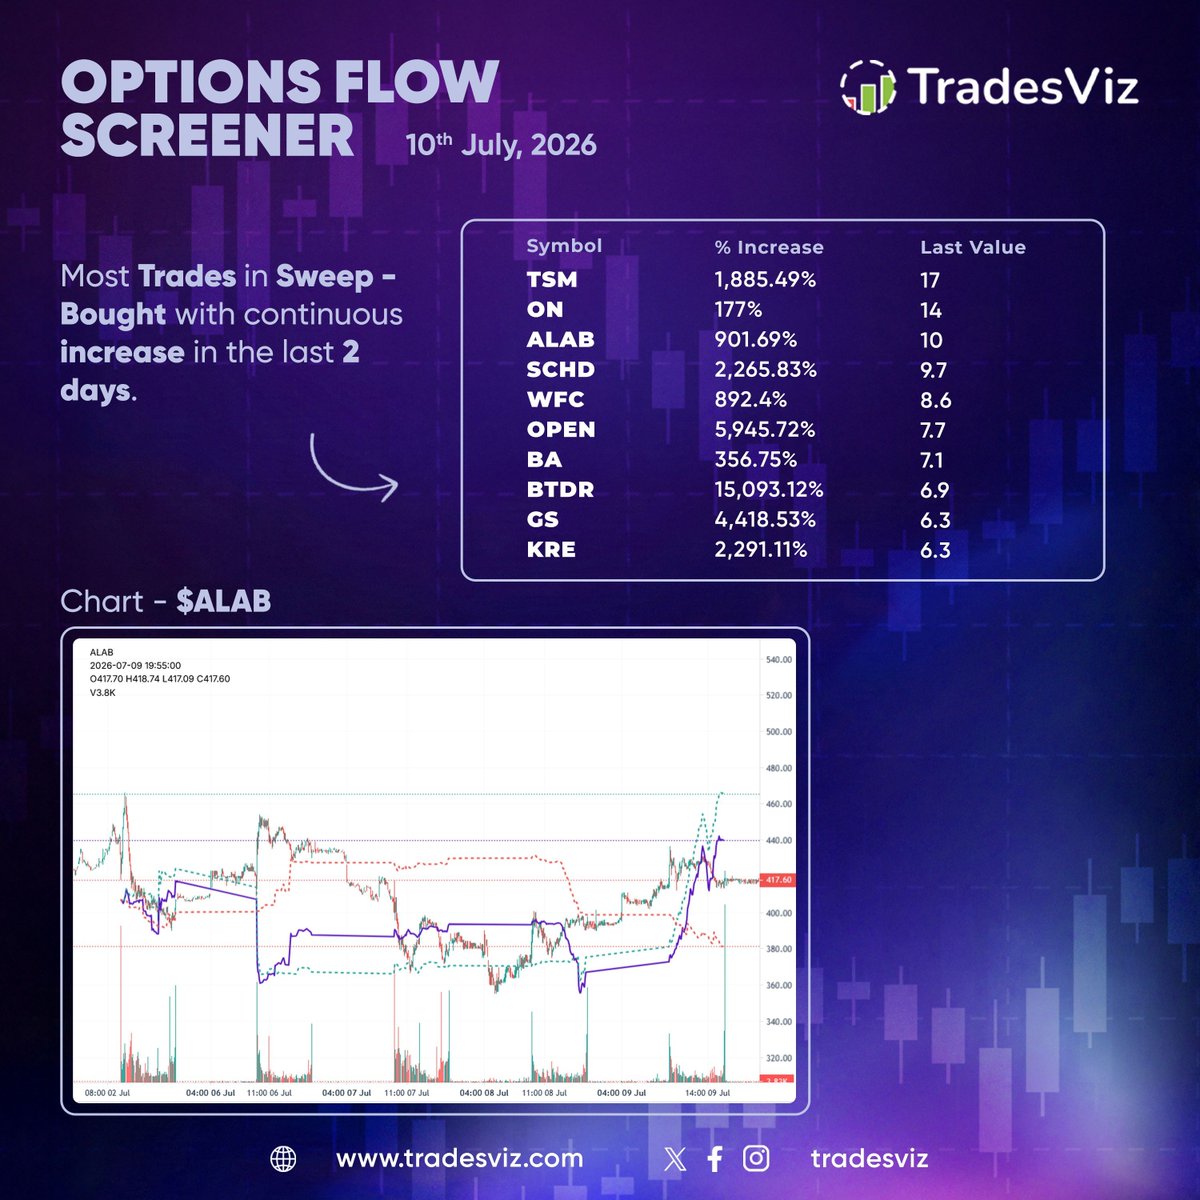
The July 10 options flow screen showed a strong surge in sweep‑buying activity across major sectors, led by tech and financials, as traders continued scaling long exposure into mid‑Q3.
$TSM posted a massive 1,885 percent increase in sweeps, signaling aggressive institutional buying within semiconductors. $ON and $ALAB followed with 177 and 902 percent jumps, while $SCHD and $KRE stood out among financial ETFs, rising 2,265 and 2,291 percent respectively as banks regained momentum. $WFC and $GS recorded similar upticks, confirming broad participation in financials.
$OPEN and $BTDR dominated the relative leaderboard with explosive 5,946 and 15,093 percent climbs — heavy short‑term positioning likely tied to speculative momentum and crypto exposure. $BA’s 357 percent rise rounded out the list, reflecting renewed optimism in industrials.
The $ALAB chart displayed clear intraday strength, with volume expanding into the afternoon and price pushing higher alongside steep call sweep inflows.
Overall tone remained decisively bullish — multiple sectors showed compounding sweep activity, indicating active accumulation rather than rotation. Institutions continued to buy dips aggressively across semiconductors, finance, and higher‑beta growth names.
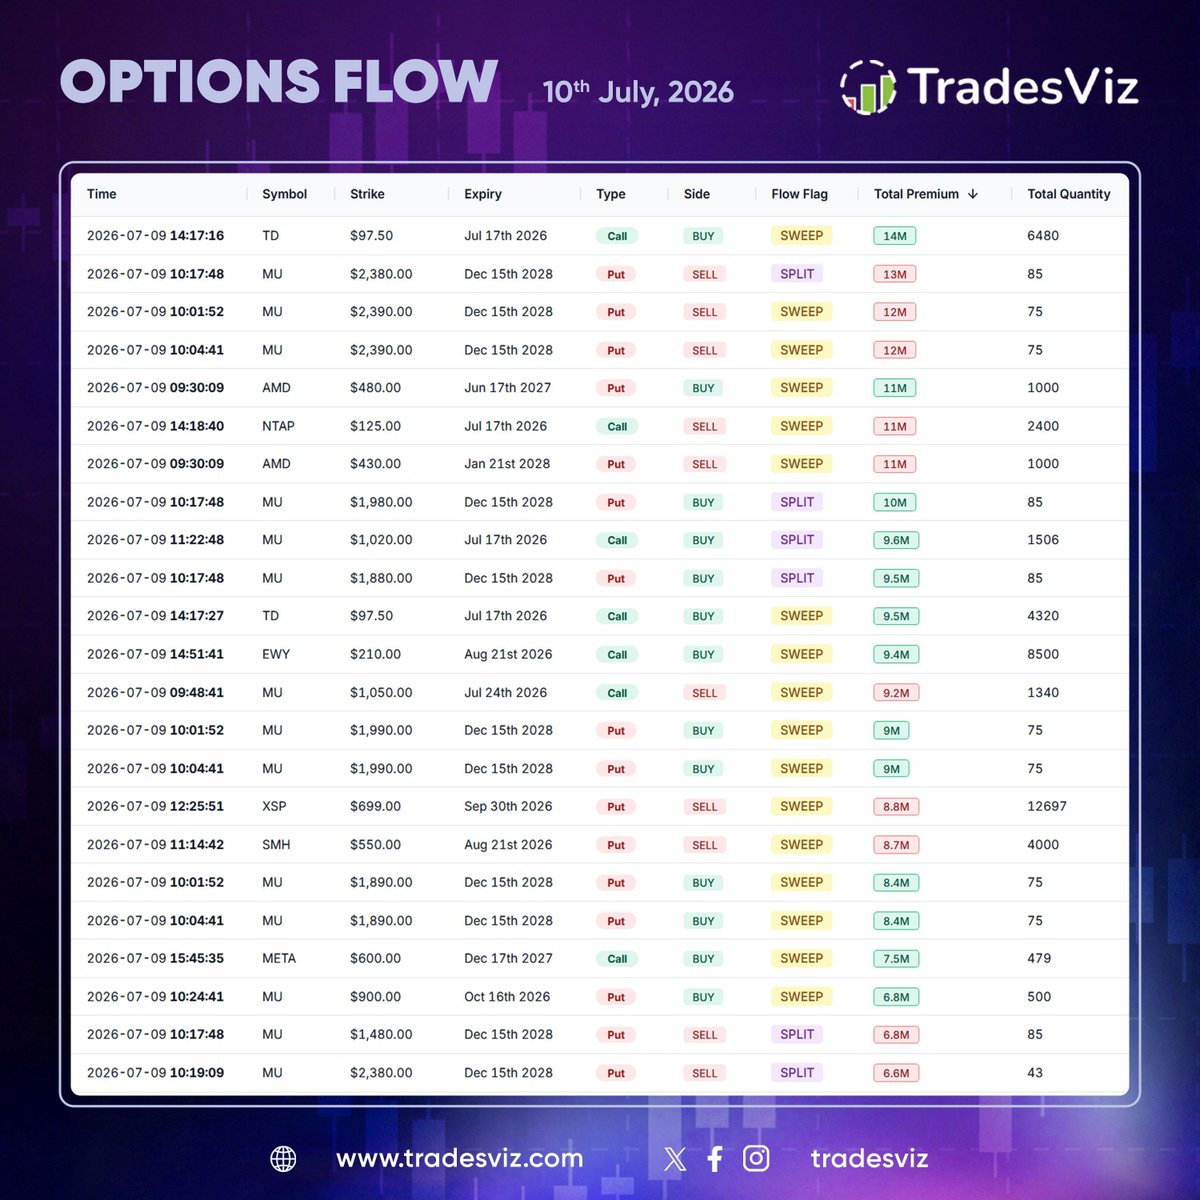
The July 10 options flow showed another heavy session of semiconductor‑led activity, with large trades stacked across mid‑ to long‑dated expiries reflecting continued institutional positioning.
$MU once again dominated the tape, accounting for over half of total large‑block flow. Repeated prints included $2380P and $2390P sweeps and splits for December 2028, each ranging from 6.8M to 13M in premium. Near‑term activity at $1020C for July 2026 and $1890C and $1990C strikes for longer maturities confirmed steady exposure management as traders rotated between short‑ and long‑dated positions.
$AMD appeared multiple times, highlighted by a $480P sweep for June 2027 and a $430P sweep for January 2028, both around 11M in size — showing parallel hedging in large‑cap chips. $META joined the mix with a $600C buy sweep worth 7.5M for January 2027, while $NTAP’s $125C sell sweep and $TD’s dual $97.50C buys balanced out tech exposure.
$XSP and $SMH also saw notable put sweeps between 8M and 8.8M, signaling broader sector hedging.
Overall tone: continued semiconductor dominance with balanced two‑way flow. Large players remained active, using long‑dated puts and selective short‑term call buys to manage exposure as Q3 trading gains momentum.