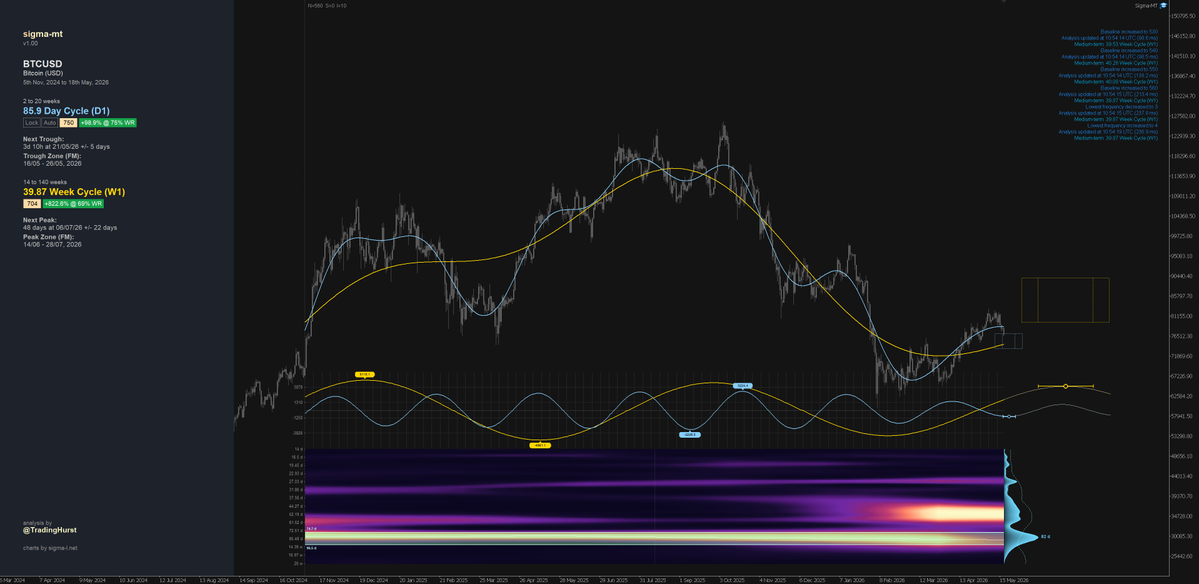
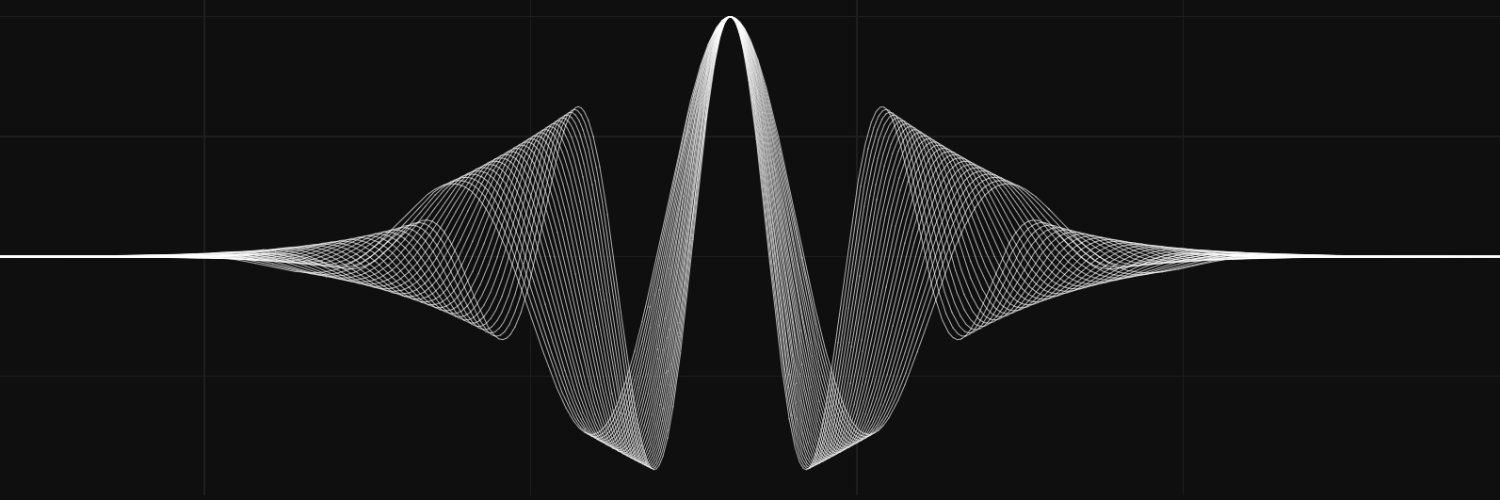
bitcoin:native and the prominent ~ 40 week cycle over the last 10 years or so. A weak up leg thus far for the latest iteration.
Analysis over bandwidth from ~ 12 to 83 weeks wavelength, weekly resolution.
#bitcoincycles
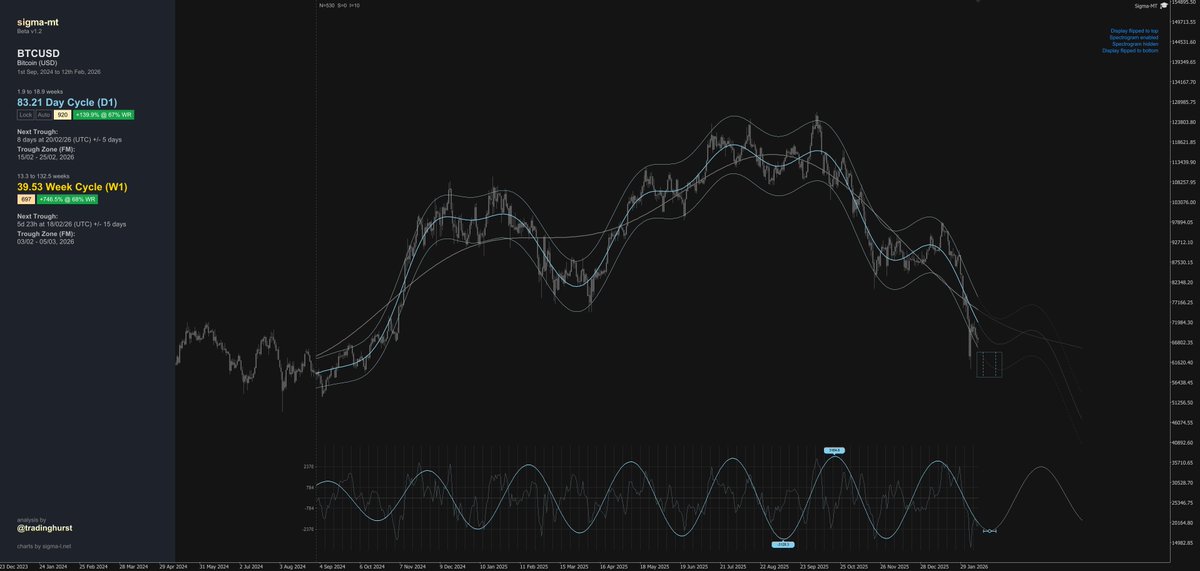
Good Morning. #bitcoin as we continue tracking the two main cycles of interest at the moment the ~ 80 day (blue) and ~ 40 week (yellow) features.
Below via Sigma-MT EA Beta v1.2
@Rektlife_ I simply let them play out. In my experience price sometimes gets to where we expect in unexpected ways. Will re-assess after the peak of this 80 day.
@DJRusse42935858 My view is that as this up leg of the current 40 week is thus far pretty placid, it's a weak sign. However I want to see how the price action looks when the 80 day up leg is over..
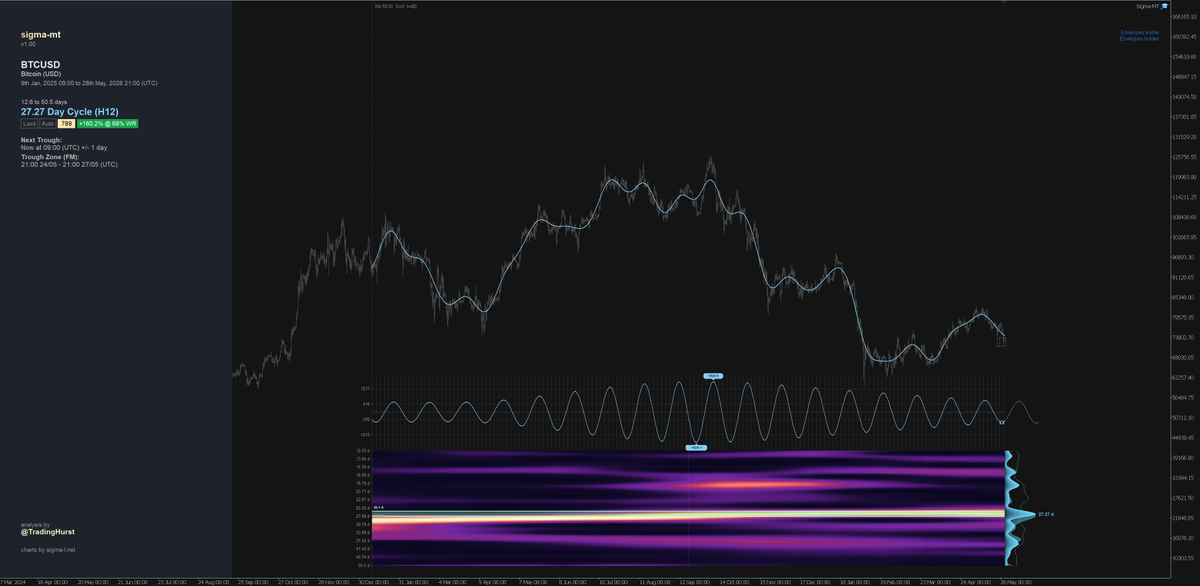
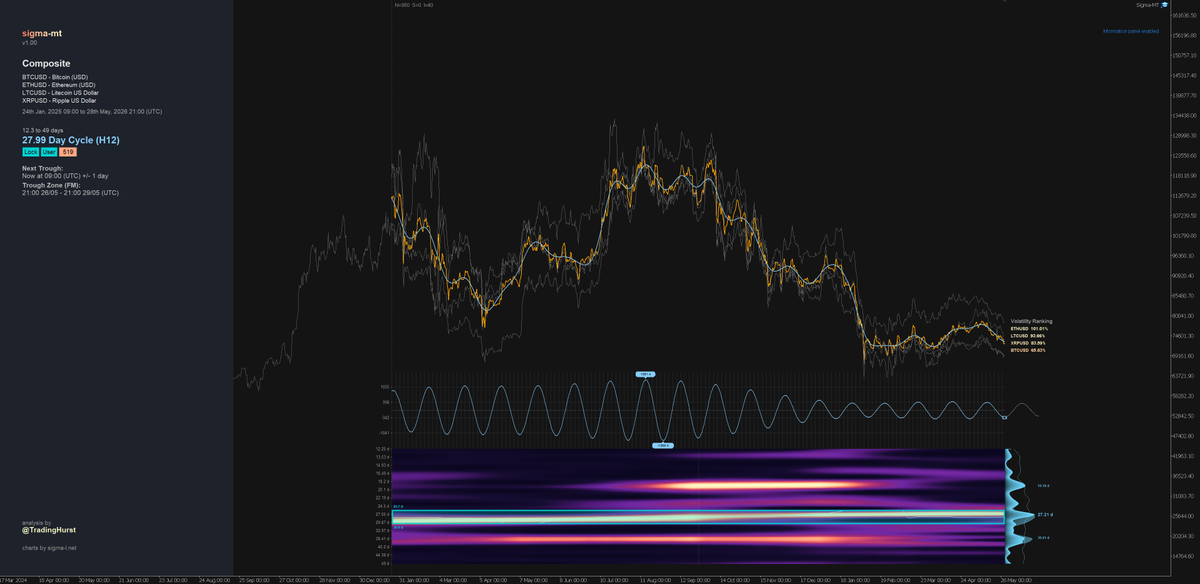
bitcoin:native and the ubiquitous ~ 30 day cycle.
Sampled from bandwidth of ~ 12 - 50 days over the last 17 months or so. 12 hour resolution.
Peak power around last Q last year and diminished since. Possible comeback for the much loved 'moon wave'?
Feature is most dominant in the OG, adding in $ETH $XRP and $LTC introduces competing power within a similar bandwidth.
@AGratefulApe@cryptoanarky Oh no there are long cycles of merit certainly (ie 40 week in Bitcoin) but the idea that troughs and peaks are synchronised perfectly and always have some integer harmonic relationship is a gross simplification. I can understand why Hurst did it though.
Progress of the two coherent cycle features in #bitcoin at the daily and weekly level as we continue.
40 week still hard up and the 80 day now well in the troughing zone.
It's been a fairly turgid rise from the 40 week low back in Feb, the two now align for possible acceleration.
bitcoin:native
@cripto17_ The 80 day in stocks is in trading days so relative to Bitcoin (which is 24 hours obvs), it is longer. Crucial distinction I should make clearer in future posts.
@AGratefulApe@cryptoanarky The principle of synchronicity is nonsense as is harmonicity to a lesser degree. There is some tenuous form of relationship between smaller and larger cycles I have observed FWIW.
@AGratefulApe@cryptoanarky Hurst proposed these for stock markets back in the 60s, however there is not that much evidence for them objectively. There is some power around the 18 month feature but nothing of any note around 54 month.
I go with the evidence, not dogma.
Below is a short video moving through a period of ~ 4 years with the time frequency microscope at each section.
One can see transitory power around 60 days and indeed it becomes dominant briefly, prior to the 80 day coming back to prominence.
This is what hoodwinked many cycle guys and gals at that point. The TF microscope is very helpful in that regard.
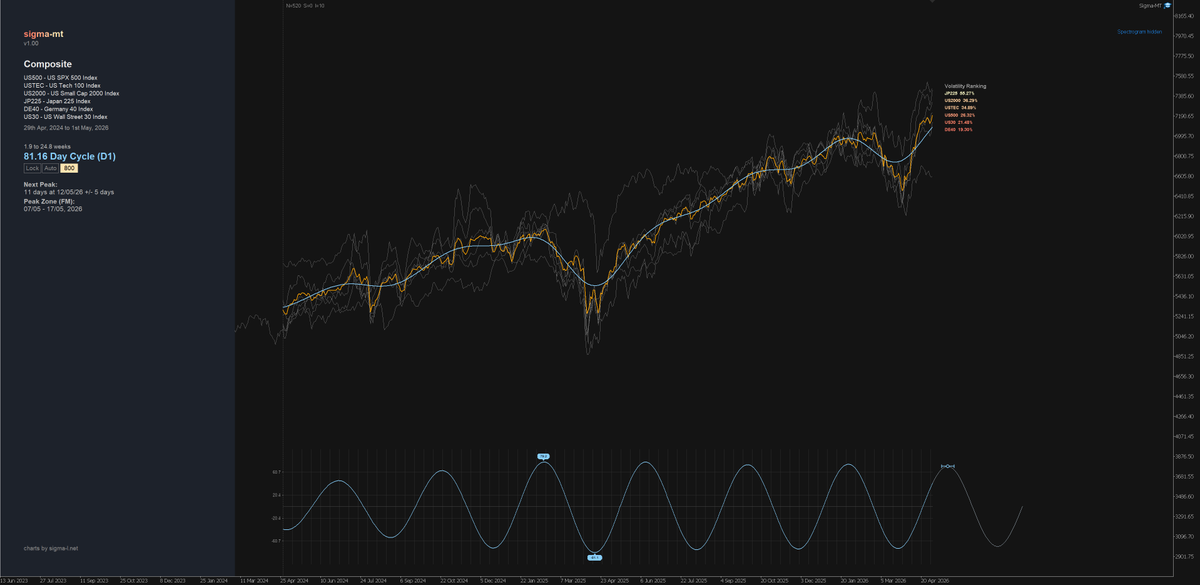
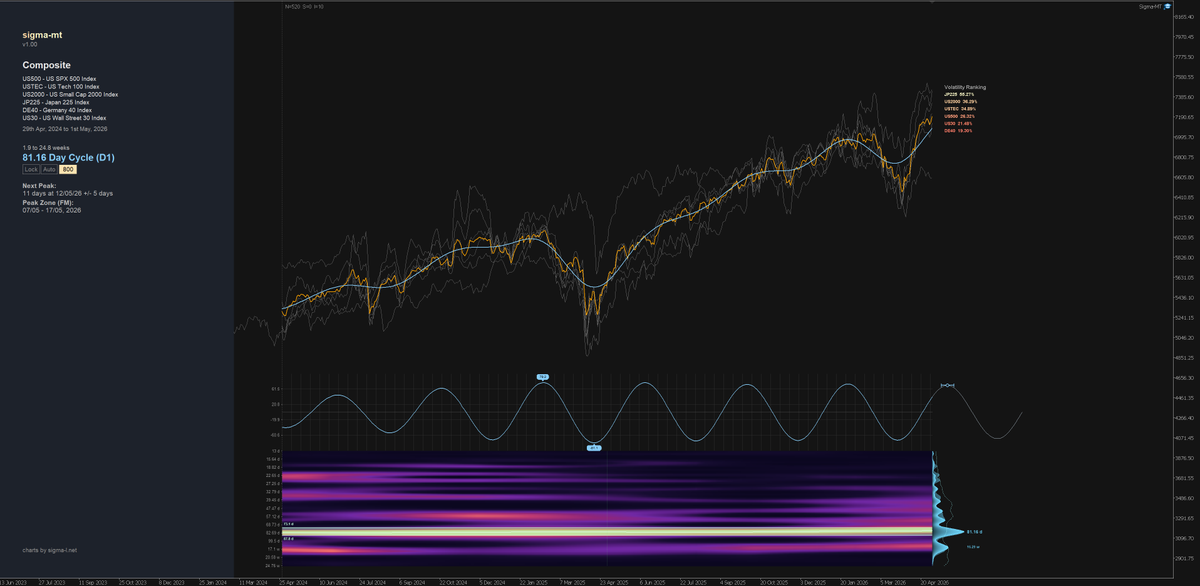
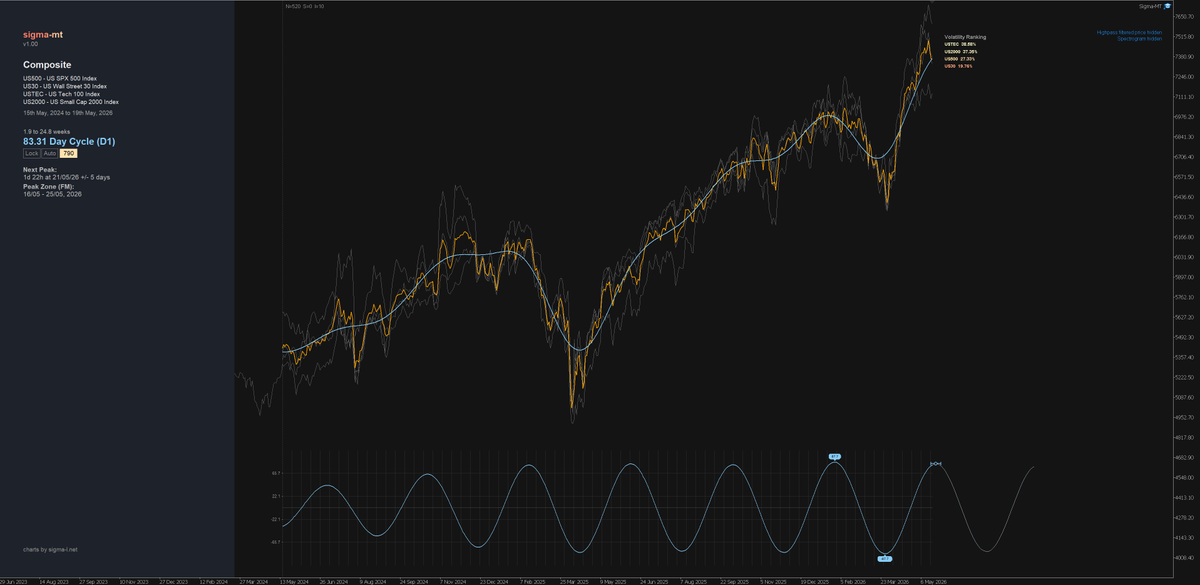
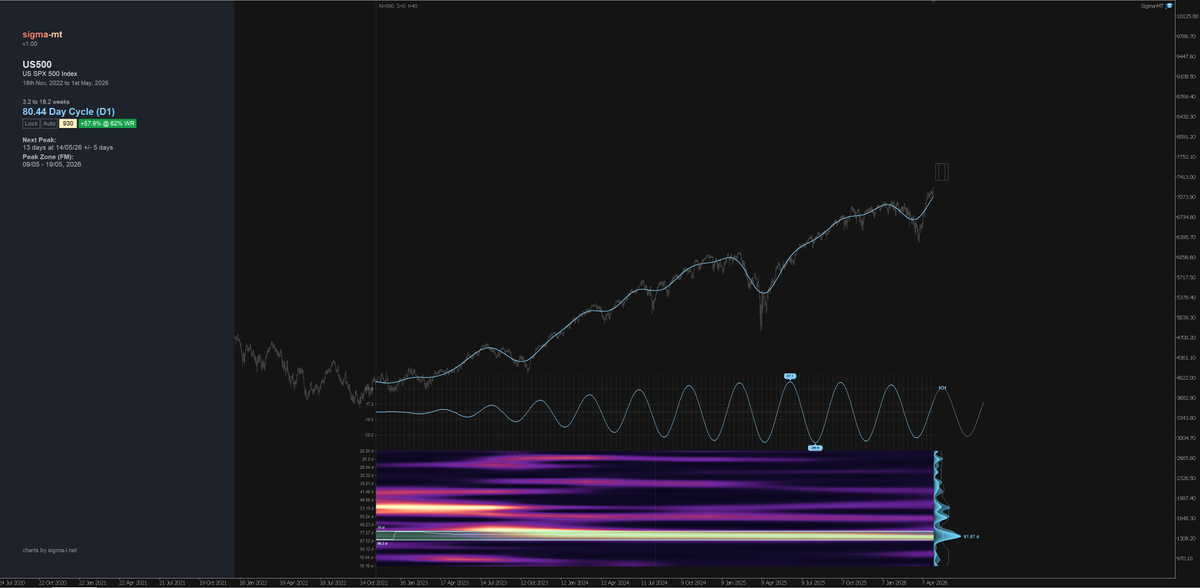
~ 80 day cycle feature in global stockmarkets as we continue. Inc DAX, S&P 500, Nasdaq etc..
Sampled over the last 2 years across wavelengths spanning ~2 to 25 weeks.
Also a longer sample in the S&P since 2022.
#marketcycles
Yes I imagine it is possible to use the 60 day but it is a proxy for the 80 day and won't encompass the same amount of price action.
Which is why it is not as powerful in the spectra (ie it does not correlate to price action as well as a periodic feature around 80 days).
If it did we would see a bright band around that wavelength, reflecting as it does frequency and amplitude stationarity around that bandwidth.
Oh and the ~ 40 week wave, to be clear, is not my cycle, it is simply the most coherent periodic feature, objectively, in the time series at the longer term. I don't own it, so to speak!