There are a few coins that's stronger than the others. Had a look at 90+ ALTs. Avoid ALTs weaker than BTC, they will give bigger dips but will probably be weak in recovery as well. This will cause your RR on a trade to be lower if you are trading the Mondays range strat, so it wouldn't make sense to take that trade. I typically don't take a trade if it's lower than Risk/Reward Ratio of 2.00, not saying you can't trade them, it's just personal choice.
Here's some examples
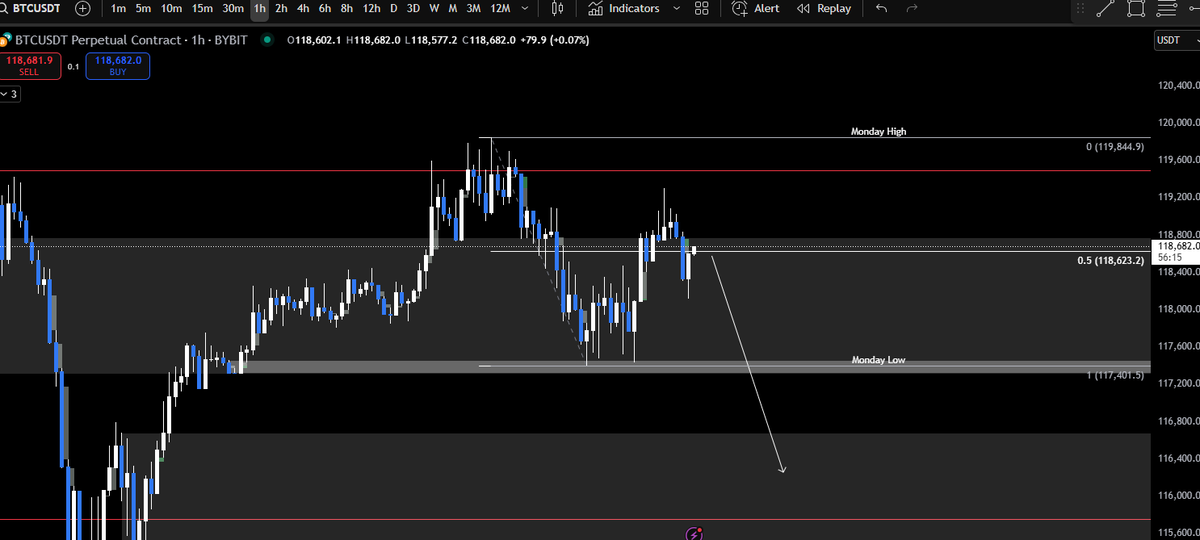
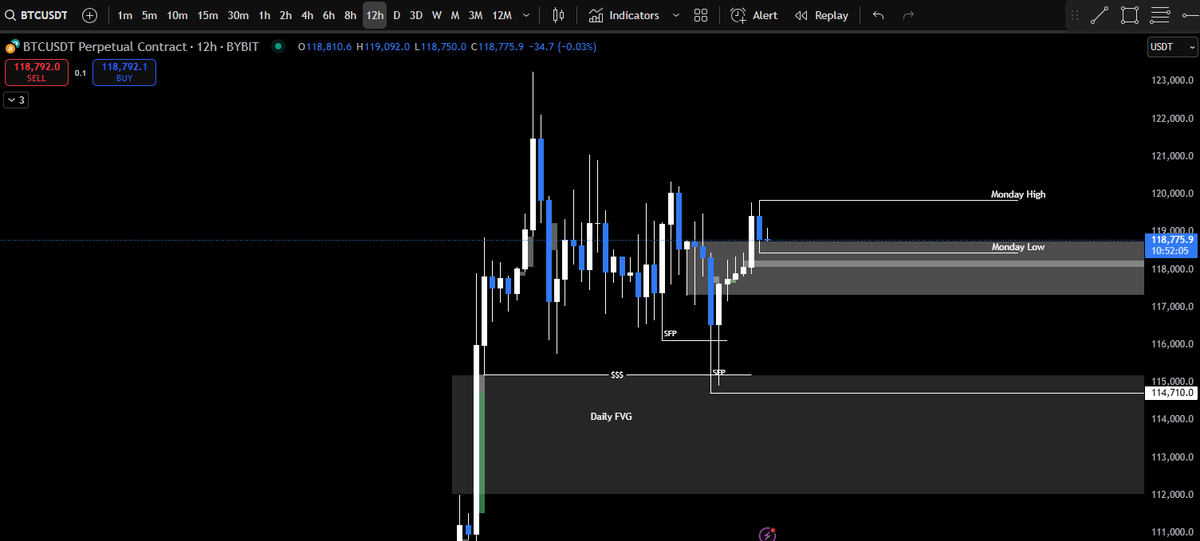
BTC, as you can see, we are still in the mid range on Monday's range, a pullback to that OB below the ALTS will shit the bed.
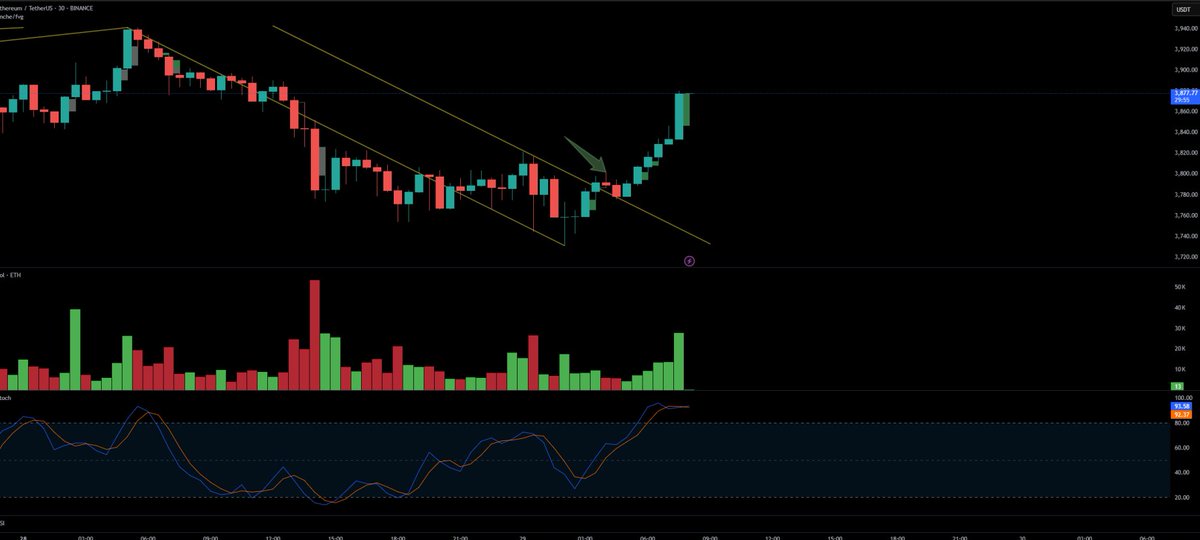
Dropping down to the 30 minute interval we can see the breakout followed by the retest which would have provided a lovely entry for the next push up. As you can see from the volume bar there was no particular spike and this is often the case so looking for these breakouts does not rely on volume.
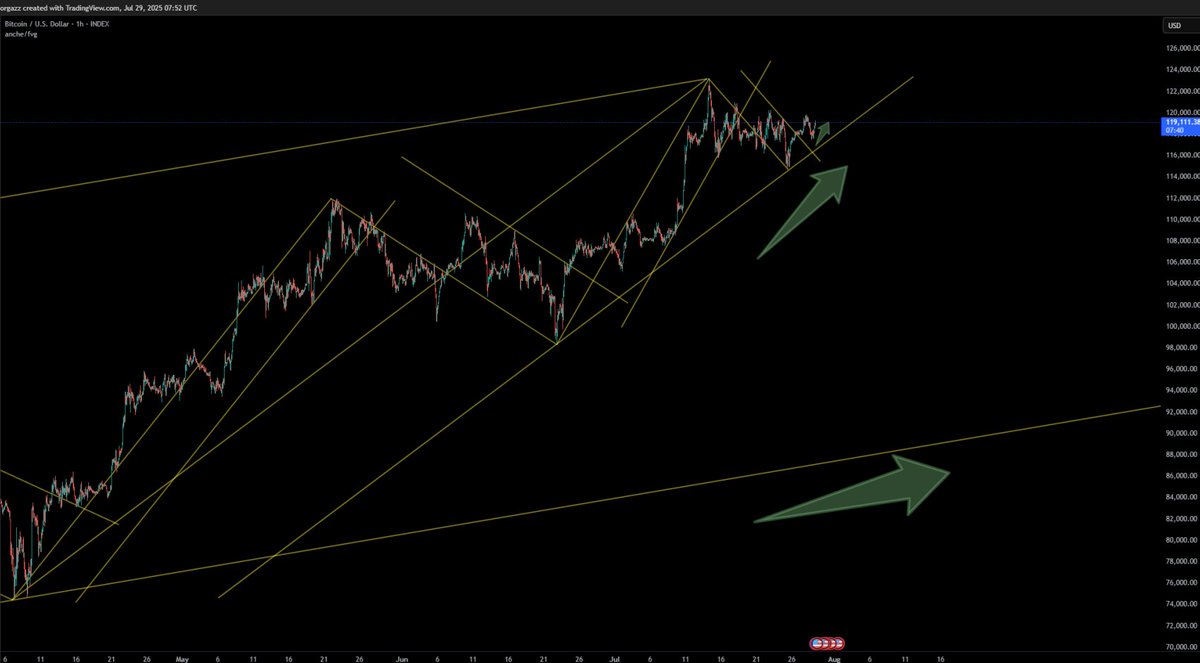
Morning troops. BTC remains bullish in all CTL phases of note breaking out of the small bearish CTL, remaining in the medium CTL and still close to the top of the largest CTL.
ETH is even more bullish than BTC. Breaking out of the short timeframe bearish CTL with some strength and nowhere near the bottom line of the medium CTL.
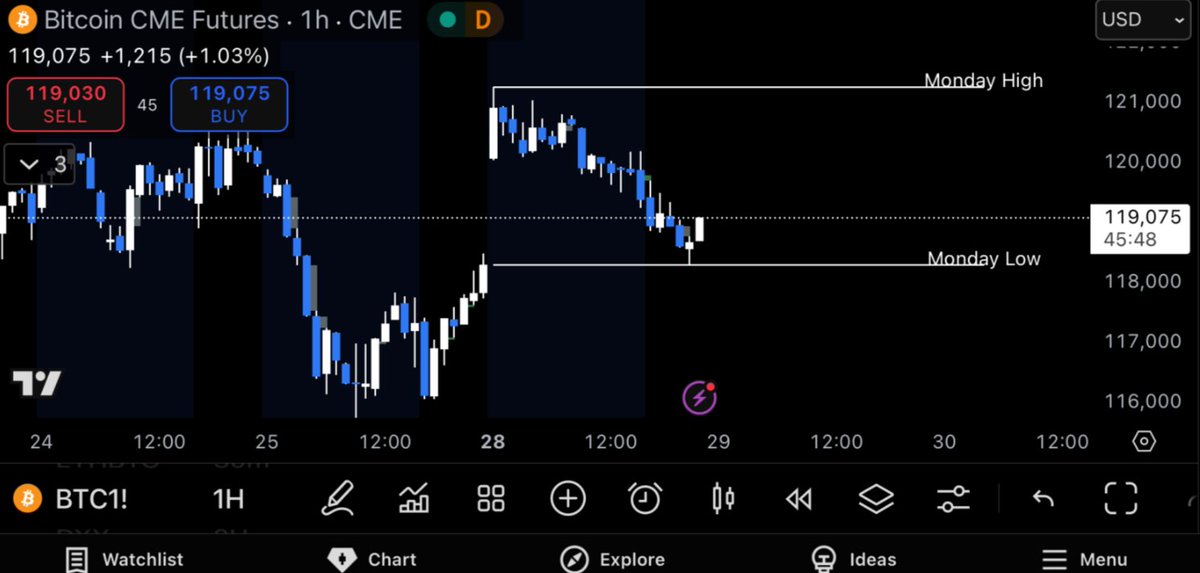
BTC Mondays range formed, quite a low % move but that will not stop us from taking positions. I'm expecting a push down perhaps into a H1/H4 OB below Mondays range to reclaim Monday's range and targeting ATH or even higher.
Carrying on from the last chart you would want to know when you can take profit. The next CTL provides you with that information. This is a very simple trading method, but it does take some time to play out, particularly on the longer time frames. In this example 43 days.
Starting with the basics. Here is a CTL on the longest timeframe. This is considered to be the strongest CTL with the most influence on price action. It is created by drawing a line from the bottom of the current movement to the top. You then clone that line and place it at the widest part of the price action within the candles between the original lines top and bottom.
This CTL is very clearly bullish with price still right at the top. Price will remain bullish until it drops out of this CTL. If price was to just go sideways now it would not drop out of this CTL until April 2026. My sentiment would remain bullish until this happened and on the largest timeframe that would be my bias.
Here is another example where the bottom seems in and there is an expected change in sentiment. The 1st candle that closed fully outside the CTL was not the best entry and there was a further 15% fall in price for the retest. Sometimes a little patience will bring you better results, but if you are prepared to wait the benefits can be considerably better. It's a personal choice like all things in trading.