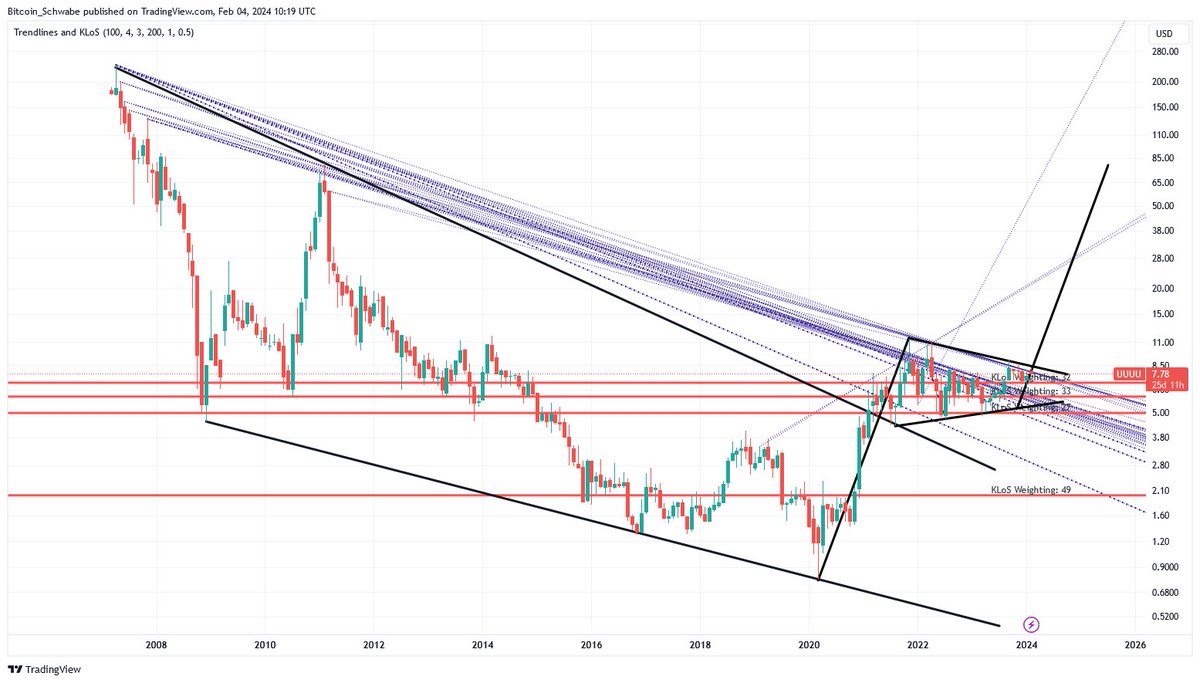
Energy Fuels looks promising. 2021 it broke out of a falling wedge and confirmed the breakout. It then consolidated in a pennant around its 3 most important Key Levels of Significance. Now it's above all KLoS, at the upper pennant trendline and faces litte resistance above. #UUUU
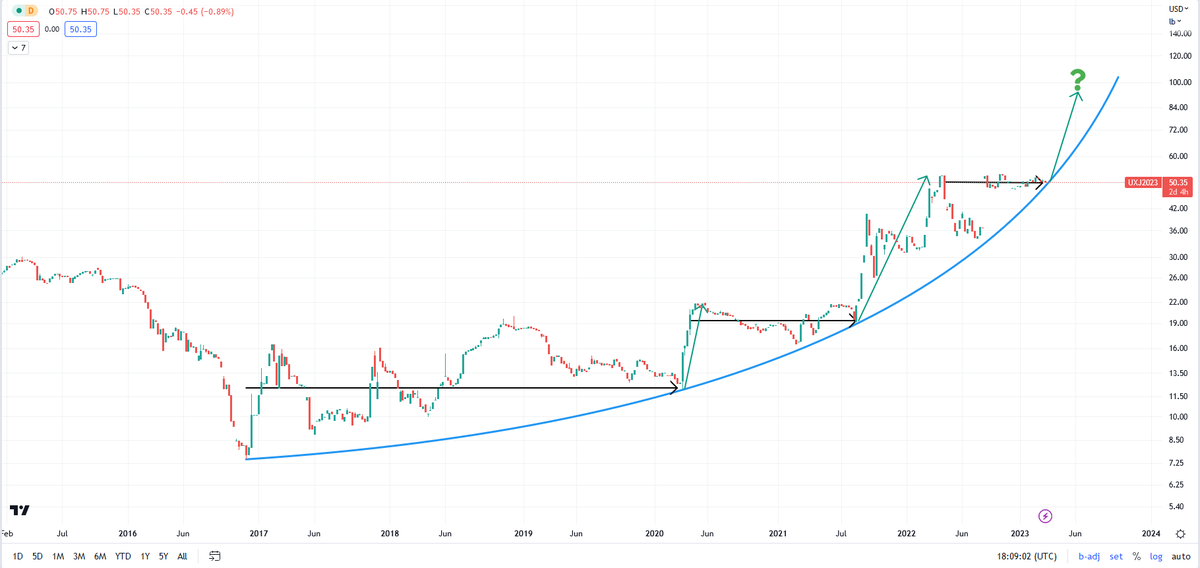
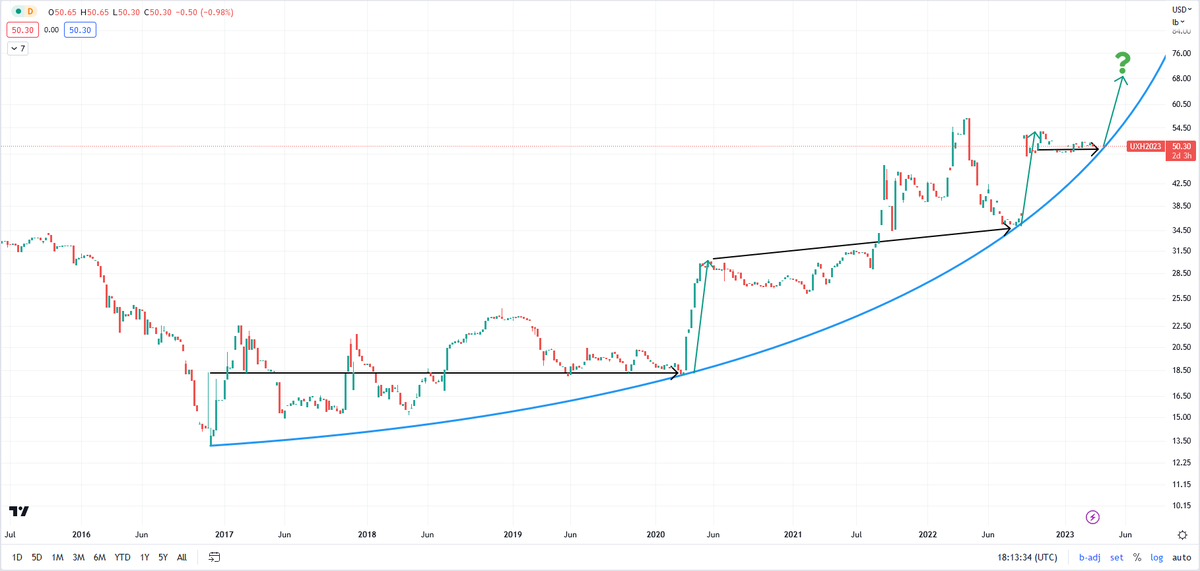
Hard not lose faith in the uranium sector. Most charts look pretty bad at the moment. The bullish fundamentals and catalysts are all in place, yet the equities keep falling. But at least the U308 Futures charts (UX1! and UX2!) still look bullish to me. #uranium
Update to my last #NATURALGAS post: Price did reach my potential green buy zone at the lower trend line of the rising wedge. I'd anticipate another strong bounce here.
Green box potential buy zone for Natural Gas. The scenario would be a continuation of the current sell-off, followed by an early/hard winter in Europe to drive prices up again, followed by a break of the rising wedge to the downside as the temperatures rise again in Europe.
#NDX#DJI and #SPX are currently all in a descending broadening wedge pattern, which usually has an 80% chance of breaking to the upside. DJI and NDX have already broken out and are currently retesting the upper trendline. Was June the bottom?
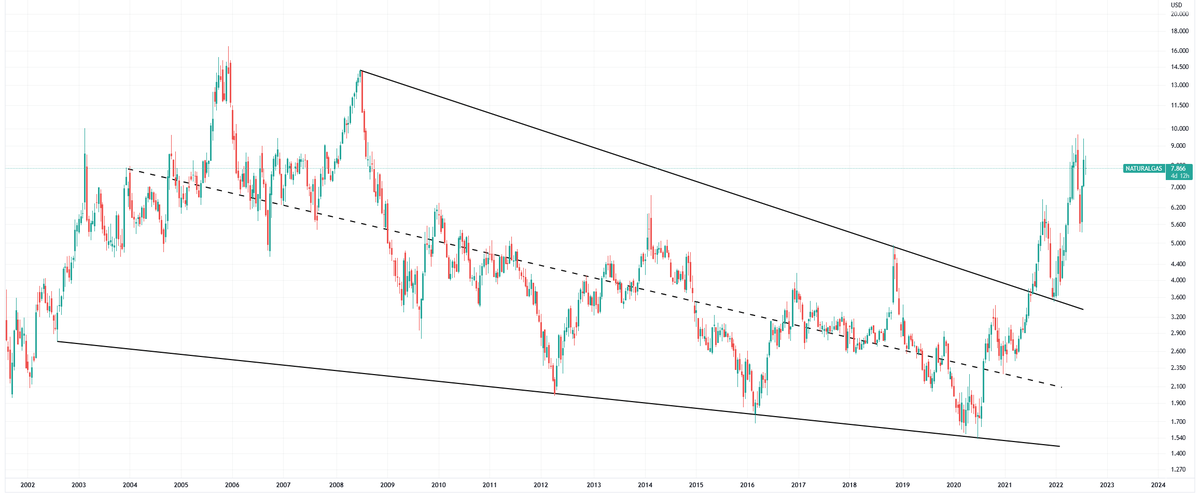
Natural Gas has yet to make the target on the 20yrs old falling wedge. Right now, in order to place an entry, I'm watching to see whether some sort of continuation pattern will form over the next months.
#WFNOESGNRG
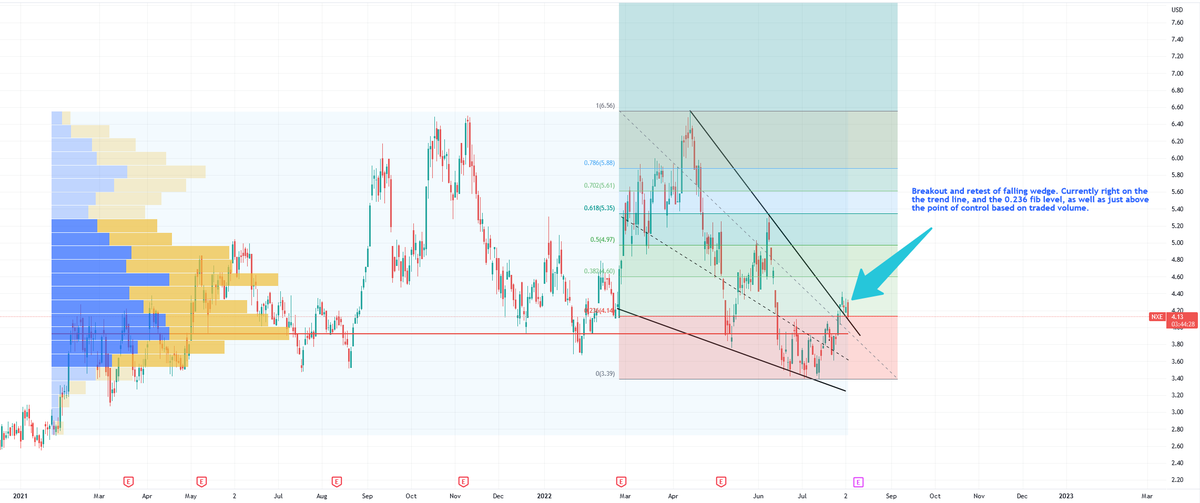
Nexgen Energy: Breakout and retest of the falling wedge. Currently right on the the trend line, and the 0.236 fib level, as well as just above the point of control based on traded volume.
#WFNOESGNRG
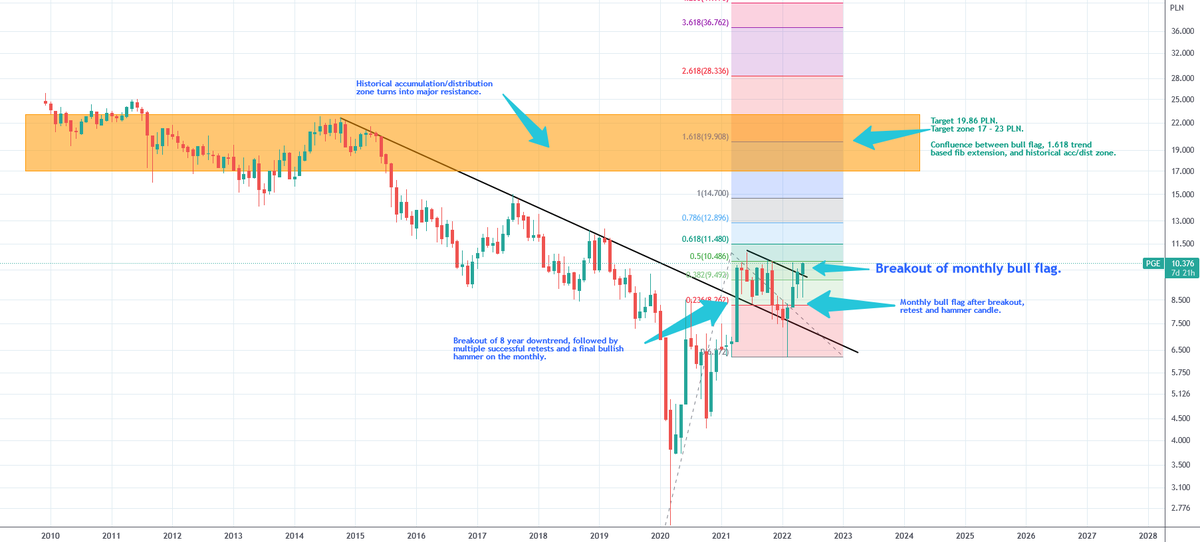
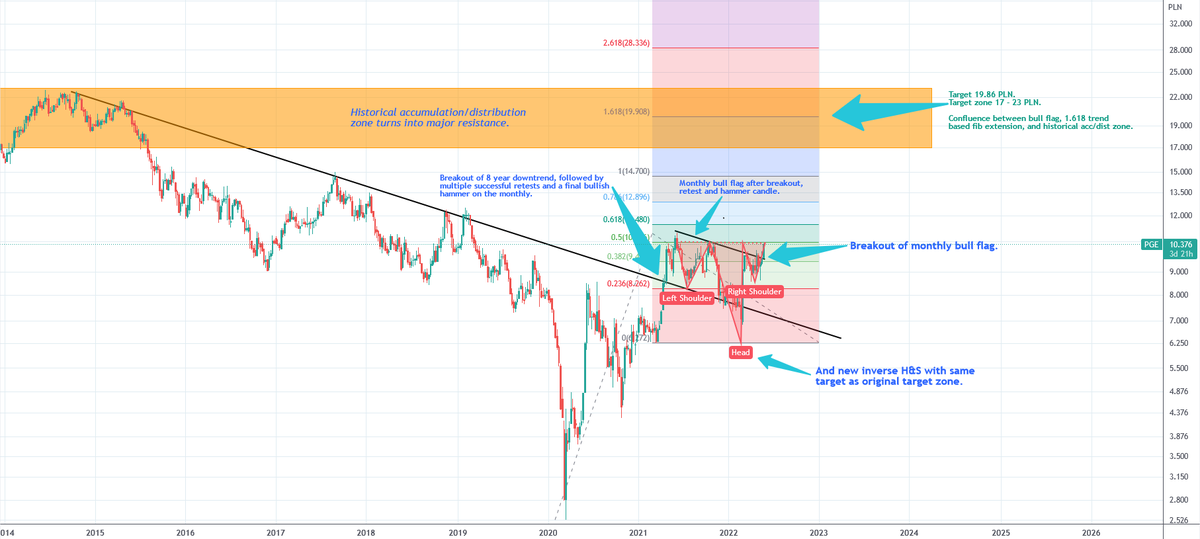
Update to: PGE Polska Grupa Energetyczna
Breakout of monthly bull flag + new inverse H&S, providing further confluence of original target zone of 17 - 23 PLN.
URA Global X Uranium ETF
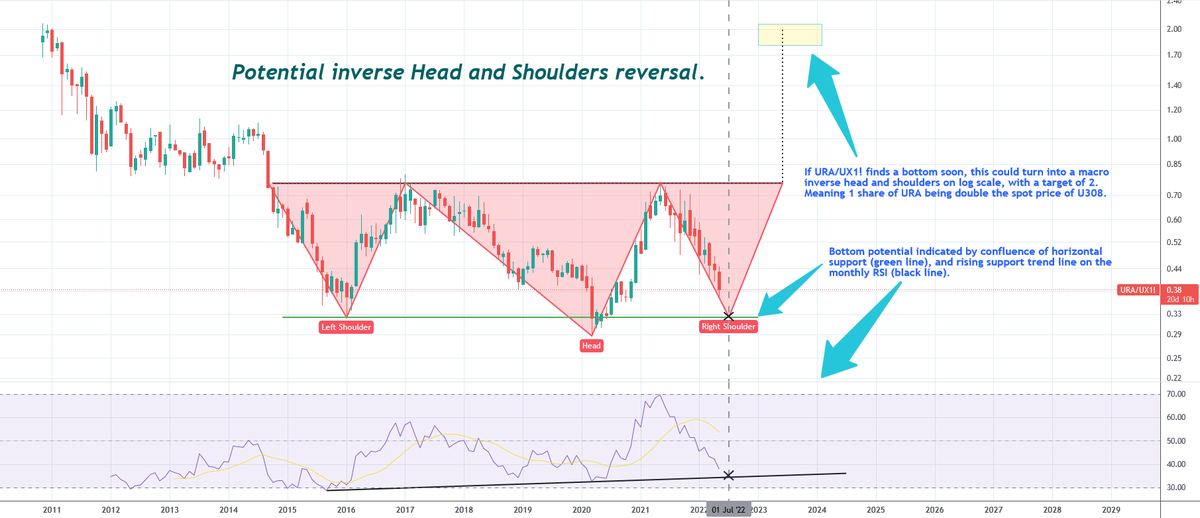
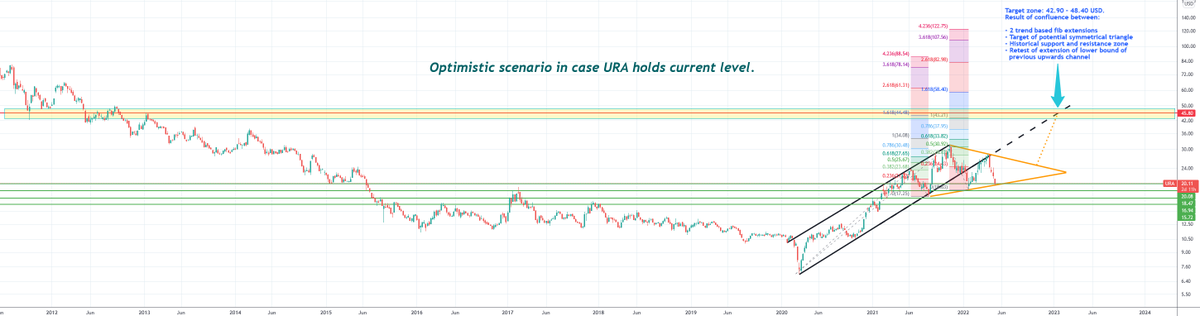
Further optimistic scenario: URA/UX1! Inverse head and shoulders reversal, which will eventually see 1 share of URA being double the spot price of U308.