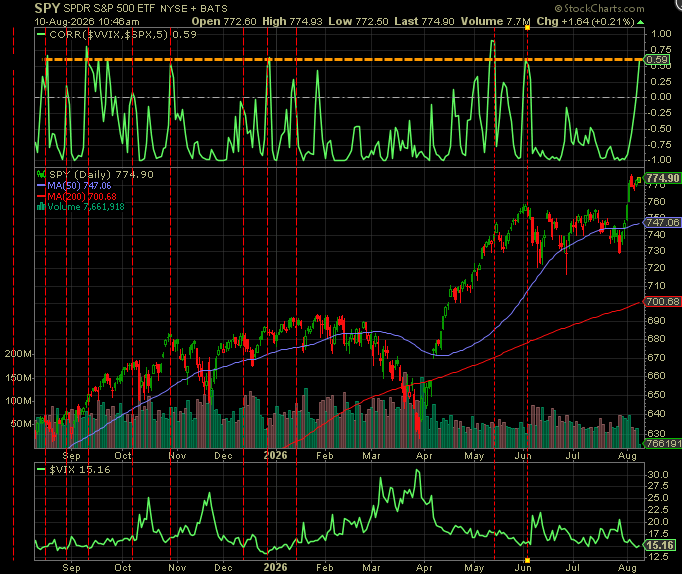
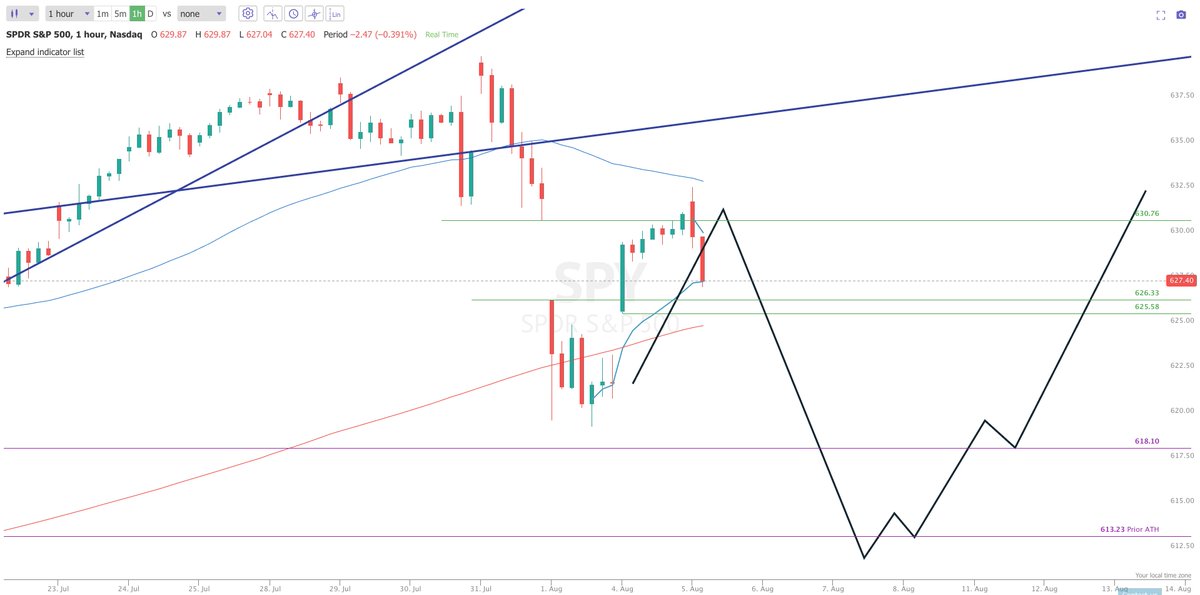
$SPY Good morning. We got a rally off an in line CPI. 766-767 is a resistance level so I’d be careful chasing longs here.I personally will wait for some weakness and a pull back to 762-760 to take calls. If I don’t get the entry today I think I’ll get it Monday.
Yesterday I wrote that I’m expecting a pause by the Fed next week, not a hike. After today’s report I’m more convinced we will get a pause and I’m willing to bet on it.
The pause will cause a massive rally that I think will break 775 and sends the market to all time highs. Then, I’ll look for the midterms short.
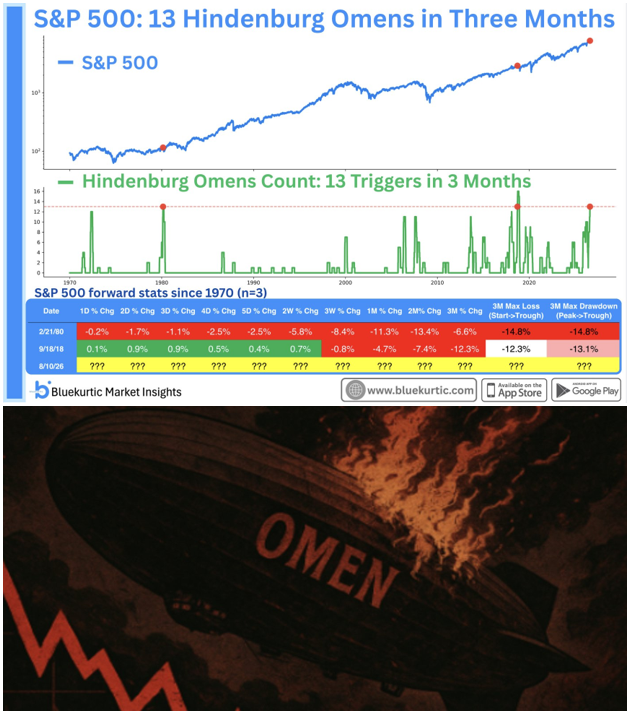
Stock Market Crash "Hindenburg" Omen Triggered 🚨
The Hindenburg Omen, an indicator that correctly detected the 1987 and 2008 stock market crashes, has been triggered 13 times in the past 3 months for the SPX 🤯 This is just the 3rd time in history with 13 triggers in 3 months
Before a true long-term bottom, you want to see this indicator flip green ✅
The Inter-Exchange Flow Pulse (IFP) tracks BTC flows between spot and derivatives. Rising flows *to* derivatives = bullish sentiment. Falling flows = risk-off.
It’s a key signal for major trend reversals.
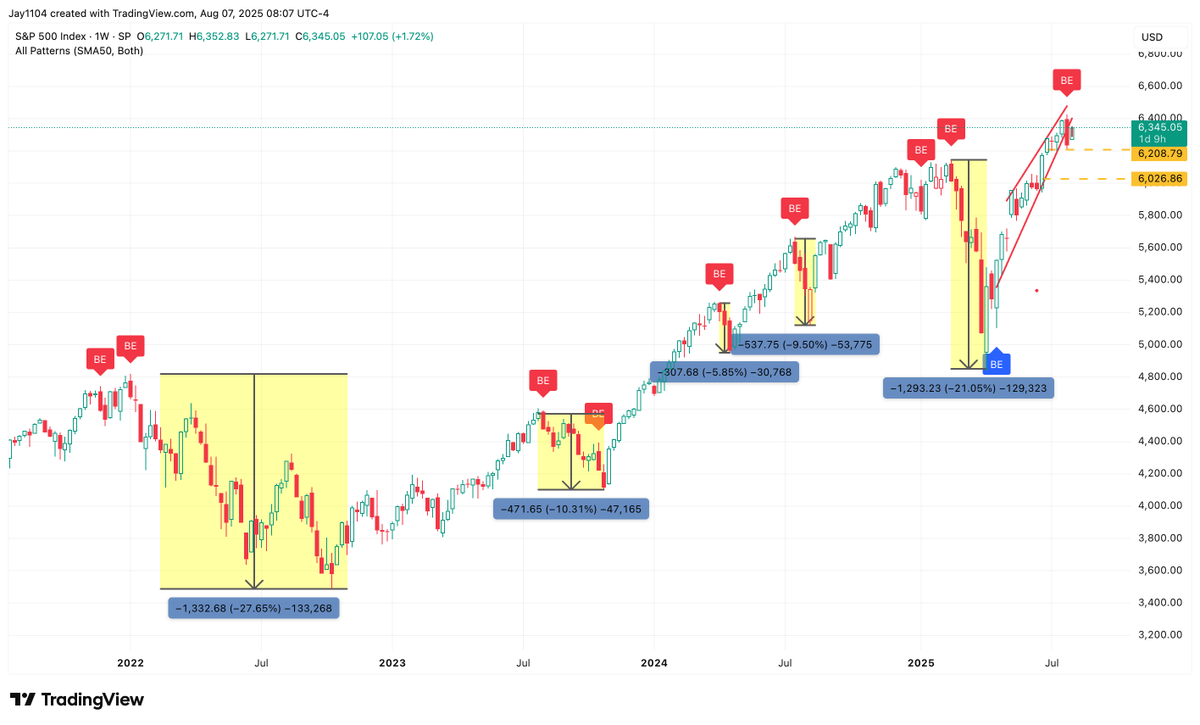
Major Top Signal
Over the last two years, pullbacks in semiconductors $SMH have been highly correlated with declines in the S&P 500 $SPX. It is therefore significant that a shooting star a reliable topping signal for semis has just appeared. As highlighted in the chart, the follow-through after this pattern has often been impressive.
Thanks for the likes and reposts on $SPY. Have a good weekend!
⚠️This has rarely happened outside of recessions:
US inflation-adjusted consumer spending has declined -0.15% at an annualized rate over the last 6 months, the most since the 2020 Crisis.
Excluding 2020, this is the weakest reading in 15 YEARS.
US consumers are not fine.
It's official:
The top 10% largest US stocks now reflect a record 76% of the US equity market.
This has officially surpassed the previous record set before the Great Depression in the 1930s.
By comparison, at the 2000 Dot-Com Bubble peak, the top 10%'s share was at ~73%.
In the 1980s, this figure was below 50%.
Meanwhile, the top 10 stocks in the S&P 500 now represent a record 40% of the index’s market cap.
We are witnessing history.
To everyone who follows me:
YOUR MISSION,
SHOULD YOU CHOOSE TO ACCEPT IT
For the next 4 weeks—
Every time you see a post about SPX order flow,
TAG ME in the replies.
I'll research each one.
(this is NOT to troll anyone)
You'll know why, soon.
—retweet this for coverage.
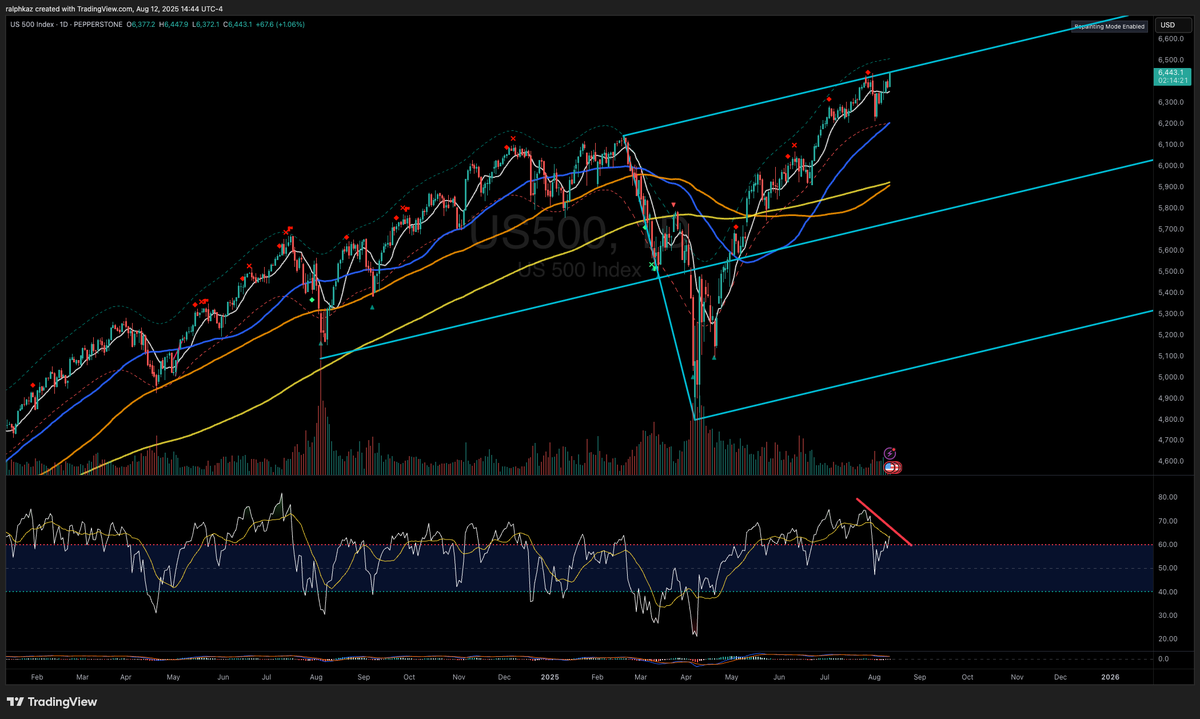
Updated 1965 analogue. Don’t think we’ll follow exact dates but should echo the overall structure / path forward: peak later this year and bear market to follow.
@fundstrat@MarkNewtonCMT
Long-term stock market, S&P 500, outlook/trajectory
If your are interested, please retweet and I'll DM you a 12-month SPX cycles projection from Sunday's Pro newsletter (must follow).