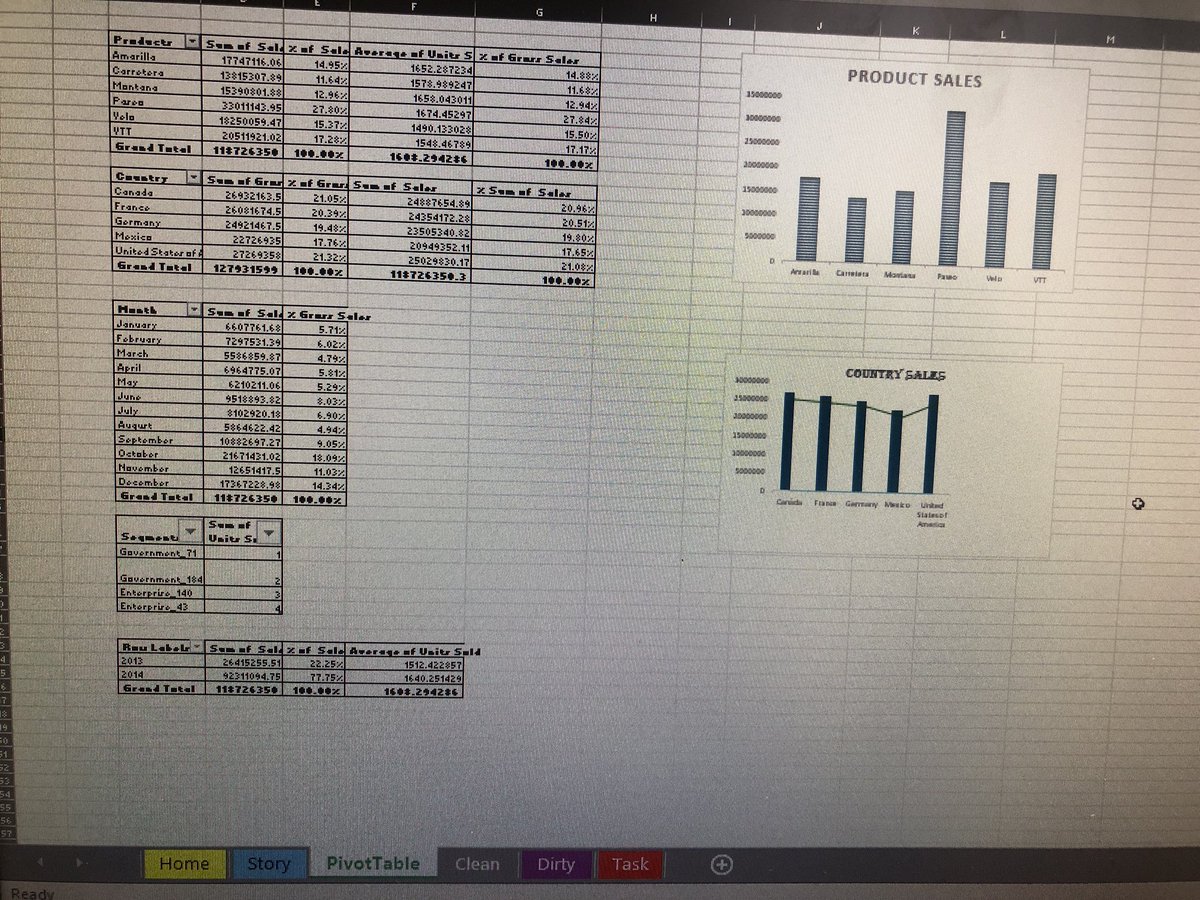
Day 28 🎉 of #100daysDAwithDatakliq: Celebrating a remarkable milestone! I built a sales dashboard, harnessing the power of PowerPivot, Pivot Tables, Charts, Shapes, Textboxes, etc. Grateful for an inspiring month of learning and growth alongside the fantastic @datakliq team. 🙏
🌟 Day 25 of #100daysDAwithDatakliq I put my learning to the test by creating a one-to-many star schema data model. With each practical step, I'm taking a deeper dive into the world of data analysis&modeling. More is coming🌚🤩.Thank you @joseph_fadero@DataKliq@EstherOyenekan_
Day 24 of #100daysDAwithDatakliq Non-stop learning✌️Further practicing of Power Pivot for data modeling. Can't wait to perfect my data modeling skills. @DataKliq
The New Python in Excel Update: 3 Cool Things You Can Do
I'm excited to announce that I've activated the new Python in Excel update! This is a powerful new tool that can be used for a variety of tasks, from data analysis and visualization to machine learning.
#DataAnalytics