New #dataviz! The Earth's submarine fiber optic cable network, visualized in #RStats with #rayrender.
Code:
https://t.co/6tFsS4vfAK
Rayrender Github:
https://t.co/iB5nWhGY7l
#MapMonday Since discovering {rayshader}, I’ve been 3D-ing everything!
Recreated a density map of Chicago shootings (2020-2024) in 3D—violence takes on a whole new look.
Which do you like more, 2D or 3D?
#MapMonday: Playing with {rayshader} for 3D maps—amazing package!
This 3D visualization highlights population density towers in Santo Domingo and Santiago, Dominican Republic, 2020 (WorldPop data).
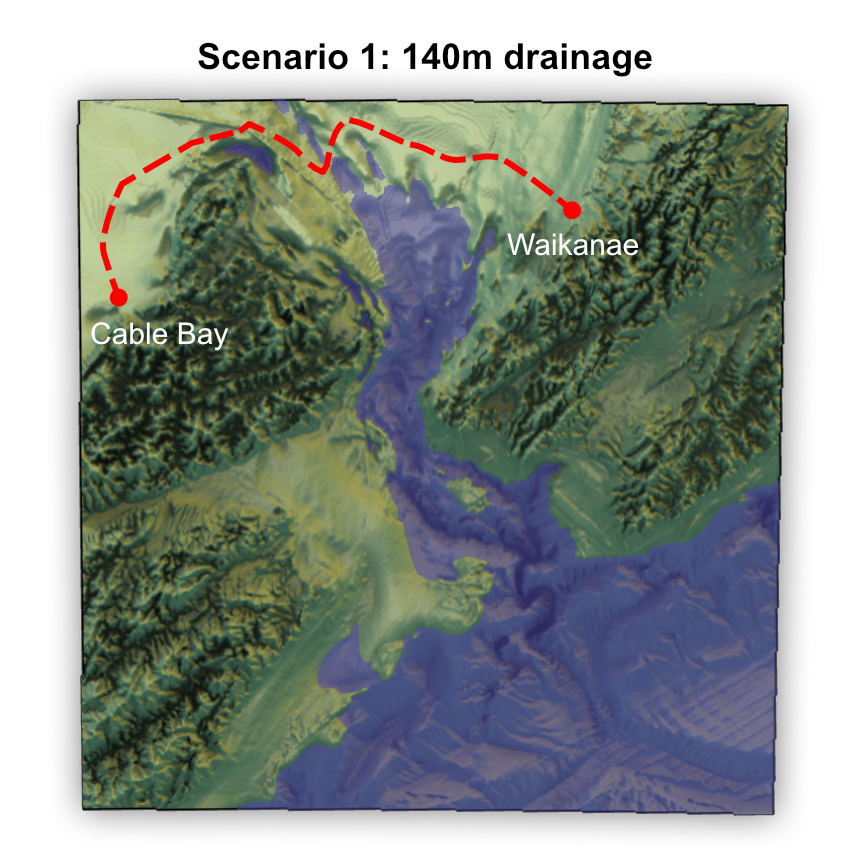
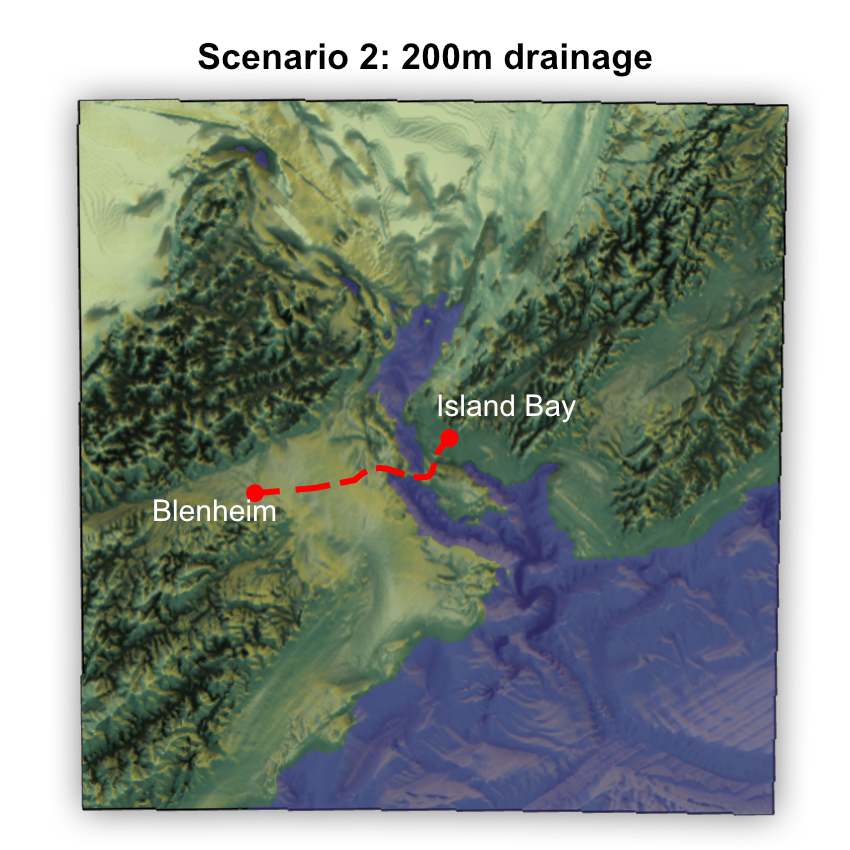
What would it look like to drain the Cook Strait - which separates the North and South Islands of New Zealand? combining @gebcobathymetry with #rayshader.
https://t.co/0FGKTwvBRo
I love that just using the power of #Rstats and #rayshader its possible to delineate catchment boundaries, download and process elevation data, and create .stl files for 3D printing.
Check out this one for the Upper Ruamahanga: https://t.co/DcwPo2Yiro
Volcanoes of Ecuador: Cotacachi
Cuicocha, with its beautiful lake, is just one little part of a gigantic volcano, known as Cotacachi. Fun fact: The word "Cotacachi" may come from the Basque language: : Cota: [altura], Cachi: [luz].
Source: https://t.co/OIuo8dzPhl
#rayshader
We have published it! This work is a view from the Neotropics on the challenges and technologies at managing data, databases, and information on the resource of biodiversity.
(Besides it contains some cool maps with #rayshader)
@tylermorganwall
https://t.co/rrBjlu1G8r
Day 1 of heat dome. The outside feels like swimming pool air.
This is totally unscientific, I'm just distracting myself from how bad this is and what it means, climate change and all.
Code: https://t.co/NjaSVbLLCj
Also, check out rayvertex's new {cli} powered pretty print classes! Preview both full scenes and even material properties (including color!) in the command line. Much better experience than parsing through thousands of lines of raw vertex data and nested material lists :)
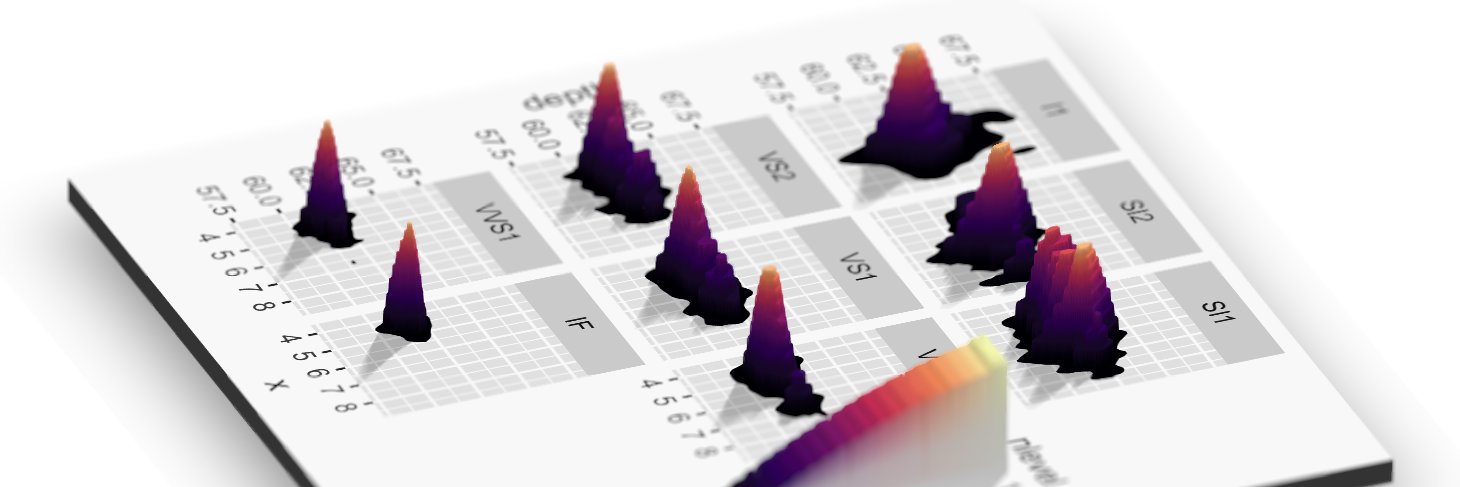
‼️New package updates, blog post, and data visualization! Learn about subdivision surfaces and displacement mapping and how they can be used to visualize data on curved surfaces using the rayverse and R.
Blog:
https://t.co/mDRFR4v5YI
#RStats#rayvertex#rayrender#dataviz
@JensWiesehahn Rayvertex provides a traditional CGI aesthetic (non-photorealistic) and doesn’t require nearly as much compute power, so it can be useful for basic 3D renders that don’t demand high visual fidelity.
Subdividing a Cornell box shows that it's actually five non-Cornell boxes pretending to be a single box in a trenchcoat!
(Lots of new features and user-facing improvements coming to {rayvertex} soon!)
#RStats#rayvertex#rayverse
@JensWiesehahn Rayshader is a high-level package focused on 2D mapping and 3D data visualizations, which in turn depends on both rayrender for realistic 3D rendering (`render_highquality()`) and rayvertex for mesh manipulation and software rendering capabilities on headless systems