@Martinjoey86@Steph_iscrypto@grok It’s what being an influencer is all about; your ‘reach’ can target people with the money you need. I think they all know this, Steph is just one of many. I mean that in the nicest possible way. Just stating the fact.
@MattPinner_ Both. The cyclist for not respecting Rule 73 and the driver of the car was not driving what I'd consider to be prudent, and cutting across the junction.
For the record I hate seeing both of these things on the road.
Looked a lot worse than it probably was for the cyclist 💰🫰
@TheCryptoZombie On second thoughts, I guess you could also argue with the third-most recent hit of the median line, that it could be considered a good sign of strength when price does something too predictable and is allowed to get there without a front-run of shorts getting in the way.
@TheCryptoZombie The 3 recent touches where the median line didn't break (starting 2024) compared to the second attempt on the first go (late 2020), worries me a tad;
We really don't want any divergence away from that median line on this next wave unless we go up and sideways like in 2023! 🫡
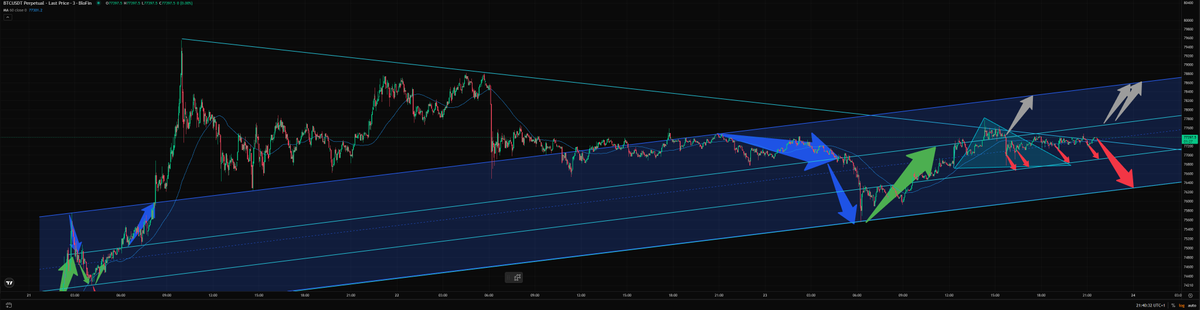
Looking purely at the behaviour here on the 3m $BTC Perp chart on #Blofin
I know where my bet would be in the near term, here.
Disclaimer: I am not in any positions. I do this for fun, without emotions getting in the way. 0% greed.
Here is a continuation to that just over 24hrs later. You can see what it means to fail to reach highs (as well as the lows) - Divergence from expectation.
I've changed the downtrend colour to Red this time too. Looks at breaks, retests and final divergence! $BTC 3m #Blofin
The triangle was meant to represent the wave in where the peak in rhythm was, and the first time the behaviour did not repeat, with the longer-downtrend likely becoming a blockade of shorts.
I'm guessing a break will happen given the amount of support in the current channel.
Ignore the trend and treat them all as horizontal channels, then let's play higher or lower! 💪
It's all about perspective. Zoom in, this channels becomes flat. Zoom out and it becomes vertical.
The basic rules to trading are simple;
1) Break
2) Re-Test
3) Diverge (front running)
The key is following the rhythm across any time frame whilst respecting the larger ones.
Ask yourself, what would the market reveal if I only respected structure, repetition, and location?
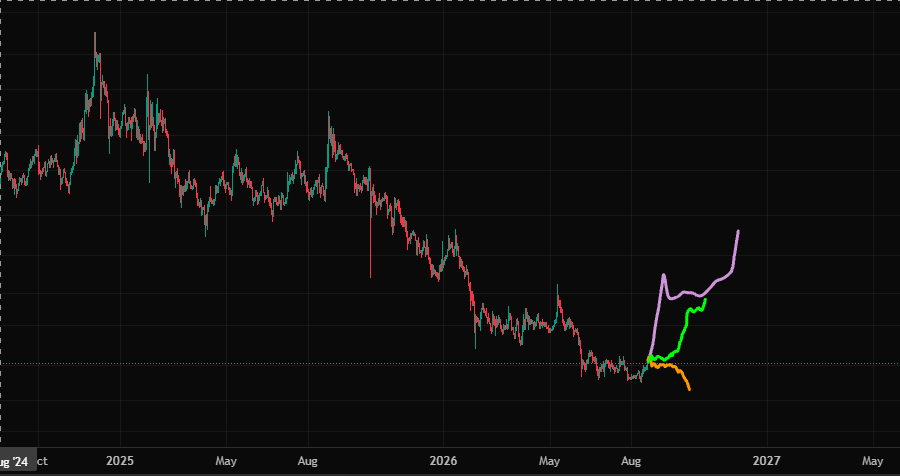
I just happened to chart $QTUM and these three situations become apparent... of course this is no guarantee that any will happen but I am bookmarking it for future reference. #EYEBALLINGTHECHART 😂
#Ethereum looking interesting on the 1-week candle chart, spanning back to 2015...
A breakdown to follow, as I am wanted elsewhere for a while...
$ETH #Bitcoin#Crypto#Investing
$BNB 1m - Those yellow lines say statistically, in the shown time frame, there has been a 100% success rate in regaining the median line after touching the base where it is now.
This is not the only token like this at the time of writing nor am I invested in #BNB