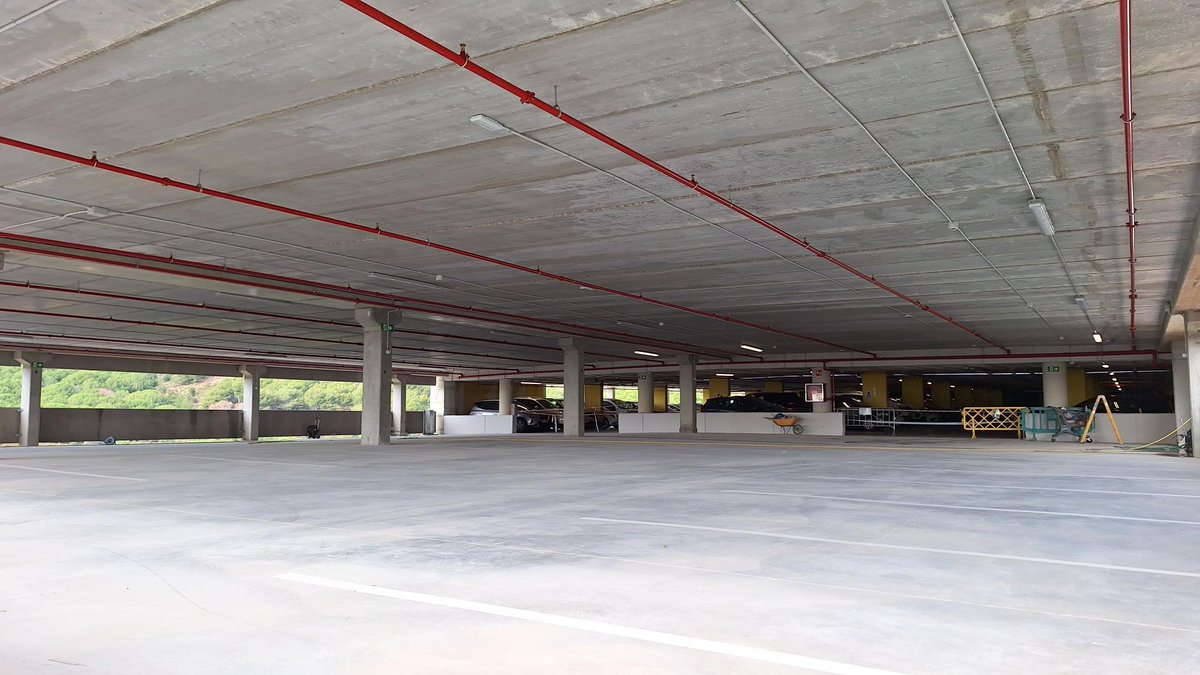
🆕 L'#hgermanstrias estrenarà dilluns l'ampliació del seu aparcament, que guanya més d'un centenar de places
🚗 L'actuació s’emmarca en un seguit d’accions que l’Hospital ha anat pensant i executant per a resoldre la dificultat d'aparcar al centre
ℹ️ https://t.co/hd38X4h7zH
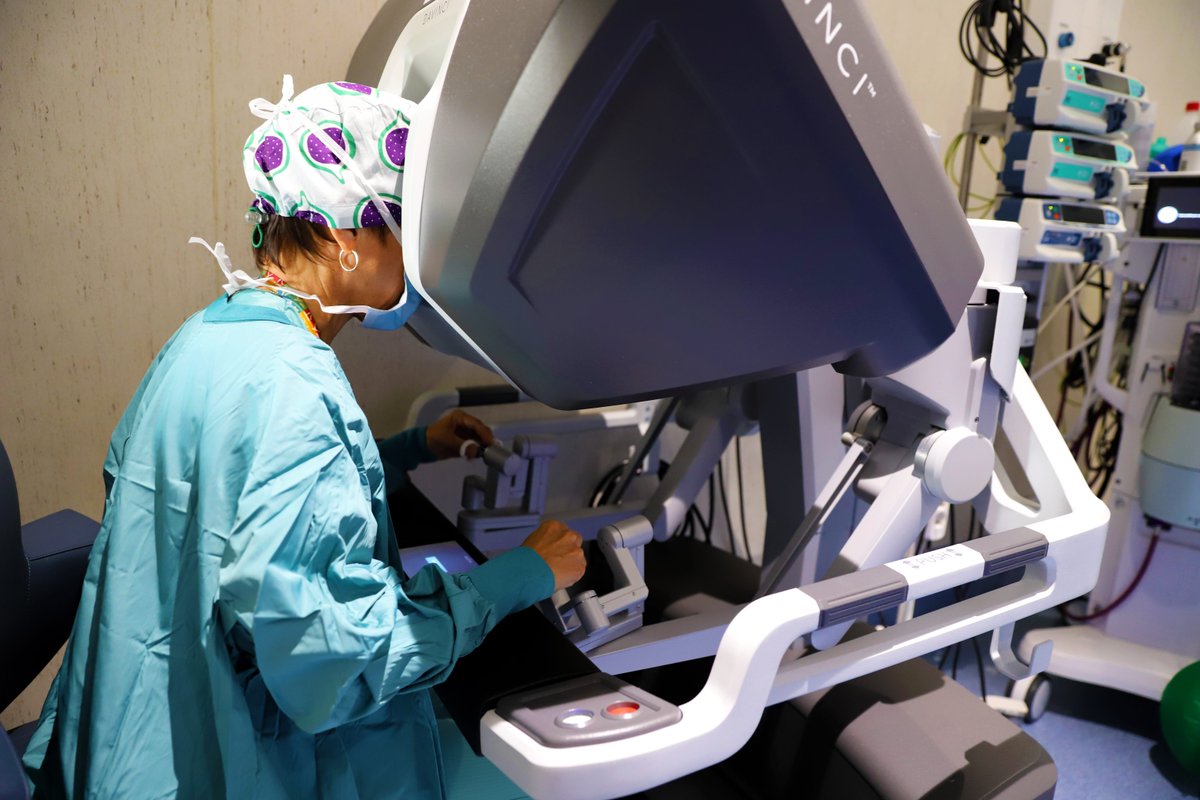
🆕 L'#hgermanstrias posa en marxa el primer programa a Europa d'intervencions quirúrgiques d'urgència amb robot
🦾 Ofereix avantatges clau en casos urgents, on temps i eficàcia són factors crítics: precisió mil·limètrica i menys risc de complicacions
ℹ️ https://t.co/xPSv8LEY9W
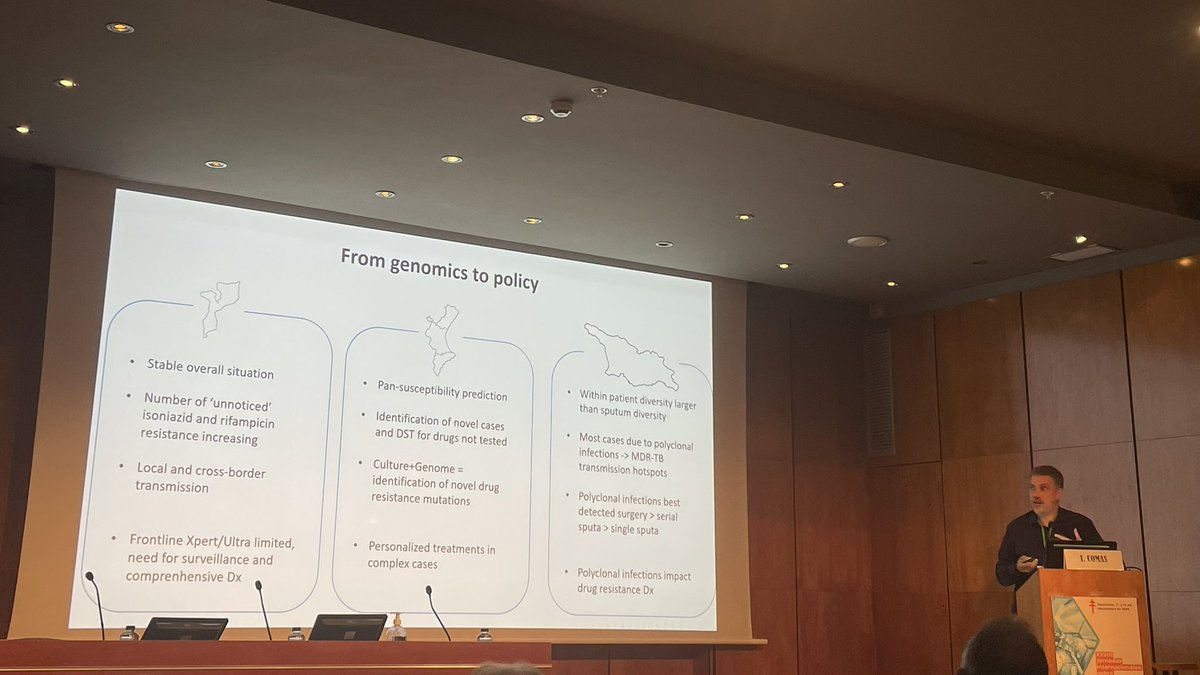
Iñaki Comas de @IBV_CSIC profundiza sobre la diversidad genética de Mtb con vistas al tratamiento y control de la enfermedad en diferentes contextos de incidencia de TB. #TB24
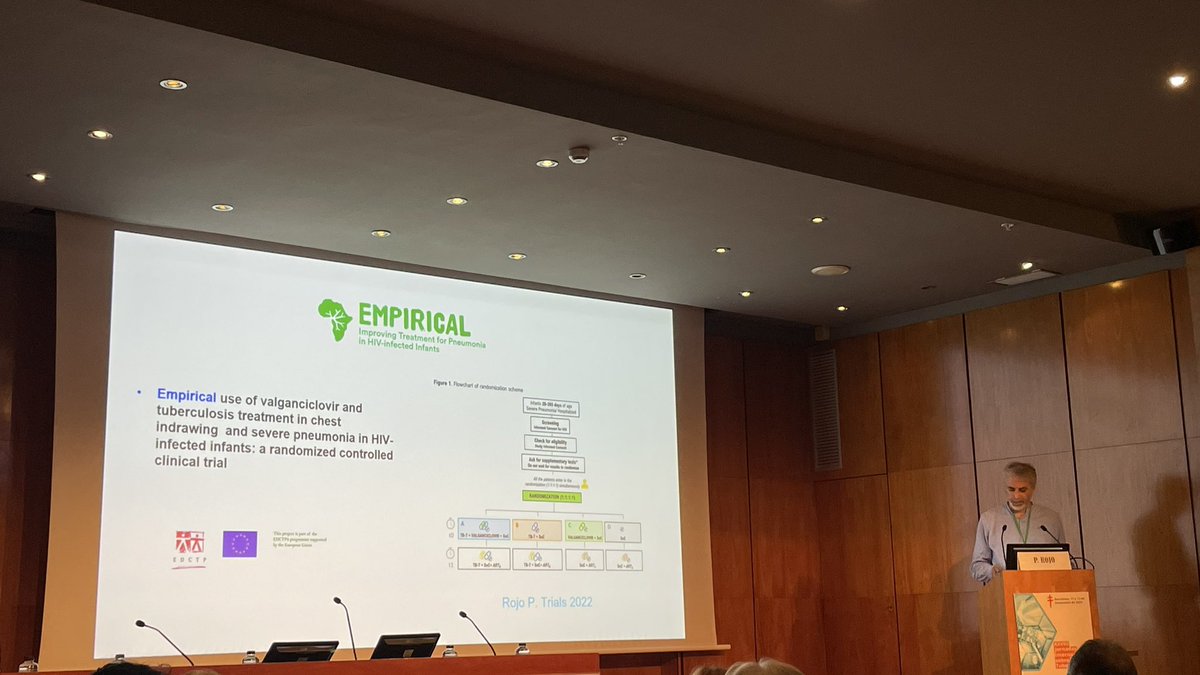
Pablo Rojo de @hospital12Oct@seipweb@SEIMC_ presenta sobre la TB y el VIH en niños, profundizando en diagnóstico, tratamiento y ensayos clínicos. #TB24
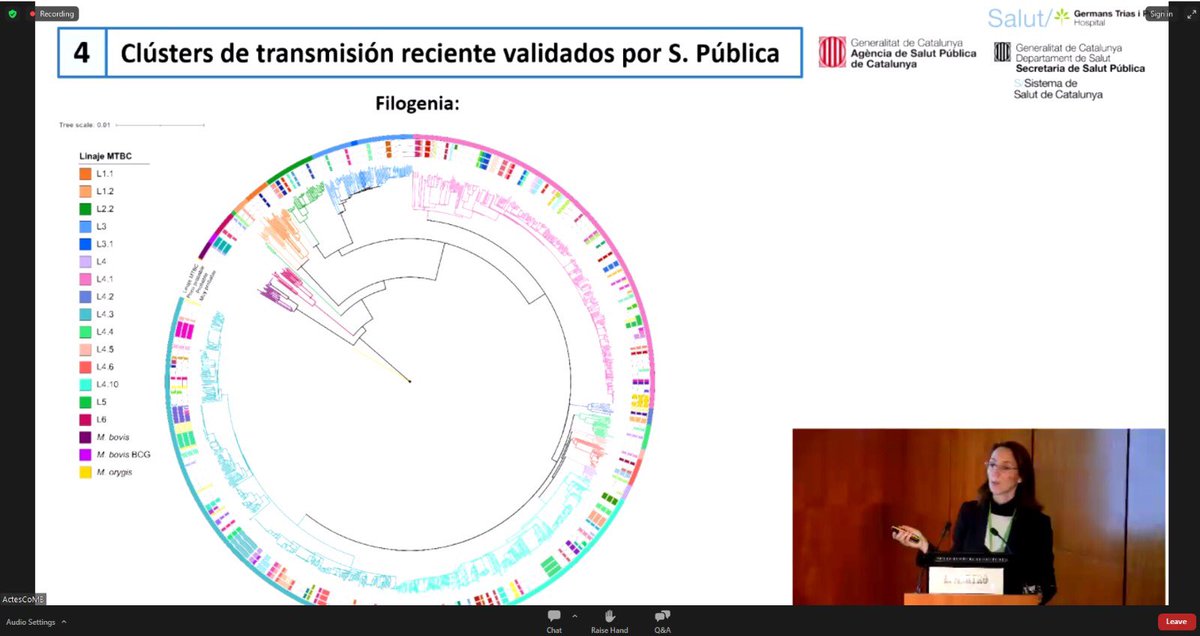
Un placer participar con Darío García e Iñaki Comas @icoes en esta interesante mesa sobre “Innovaciones y avances en epidemiología genómica en estudios de contactos” en #TB24@TB_UITB presentando la estrategia #TBSEQ , esfuerzo de equipo multidisciplinar 👍
@GTRecerca@salutcat
💙💙💙 Something is happening on the blue side! We’re not there yet, but we can get there.
I’ve created a Starter Pack to join the TB & mycos aficionados community with a single click.
Come and join us! 💙💙💙
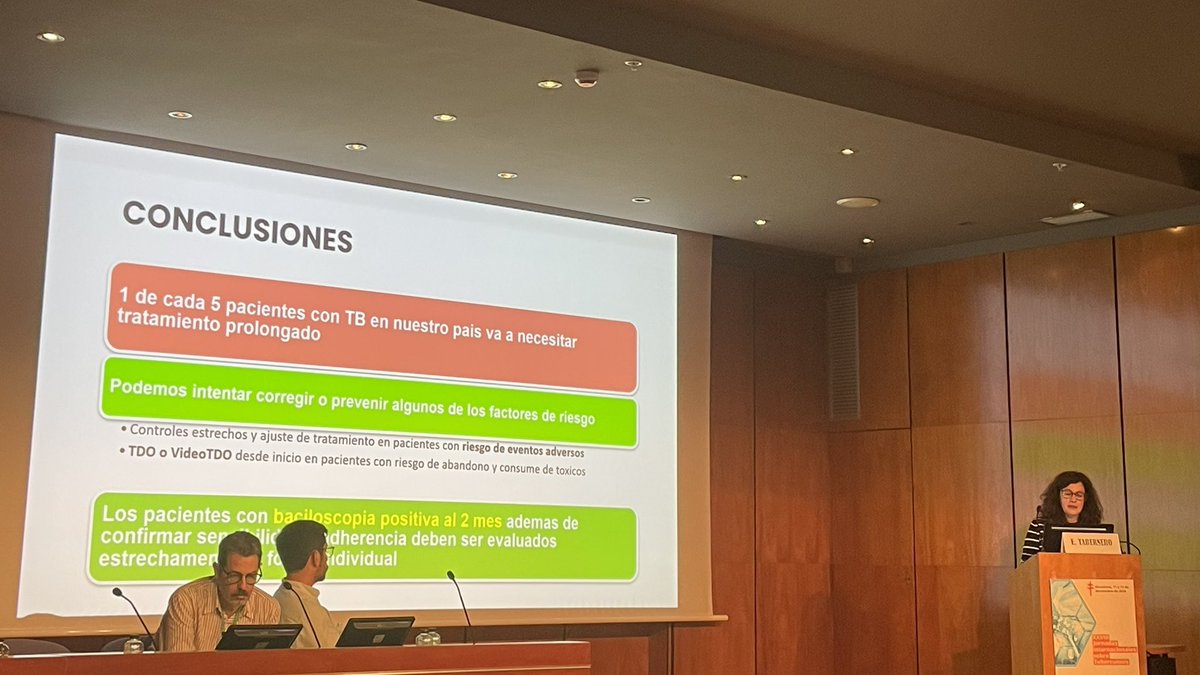
Eva Tabernero de @OSIEECruces@SEPAR_PII_TB presenta un estudio retrospectivo sobre los factores asociados a la prolongación del tratamiento de la TB. #TB24
I've just explored the brand-new tidyplots package in R, and it’s impressive how effortlessly it enables you to create beautiful, publication-ready plots. Designed with scientific papers in mind, tidyplots lets you build, adjust, and refine plot components gradually, all with a consistent and intuitive syntax that takes the complexity out of visualization.
✔️ Simple Syntax: Tidyplots offers user-friendly functions for creating polished visuals with minimal coding, saving you time and effort.
✔️ Consistent Style: Achieve a cohesive look across all visuals, eliminating the need for repetitive adjustments.
✔️ Flexible Customization: Easily customize colors, labels, and themes to align with your project’s goals, resulting in professional and engaging data displays.
✔️ Enhanced Data Storytelling: Built for clarity, tidyplots helps you convey insights effectively, making your data stand out.
The example visualizations shown here were created by the package author, Jan Broder Engler, and are featured on the tidyplots website: https://t.co/fgIWzxFVZI
#rstats #dataviz #tidyverse
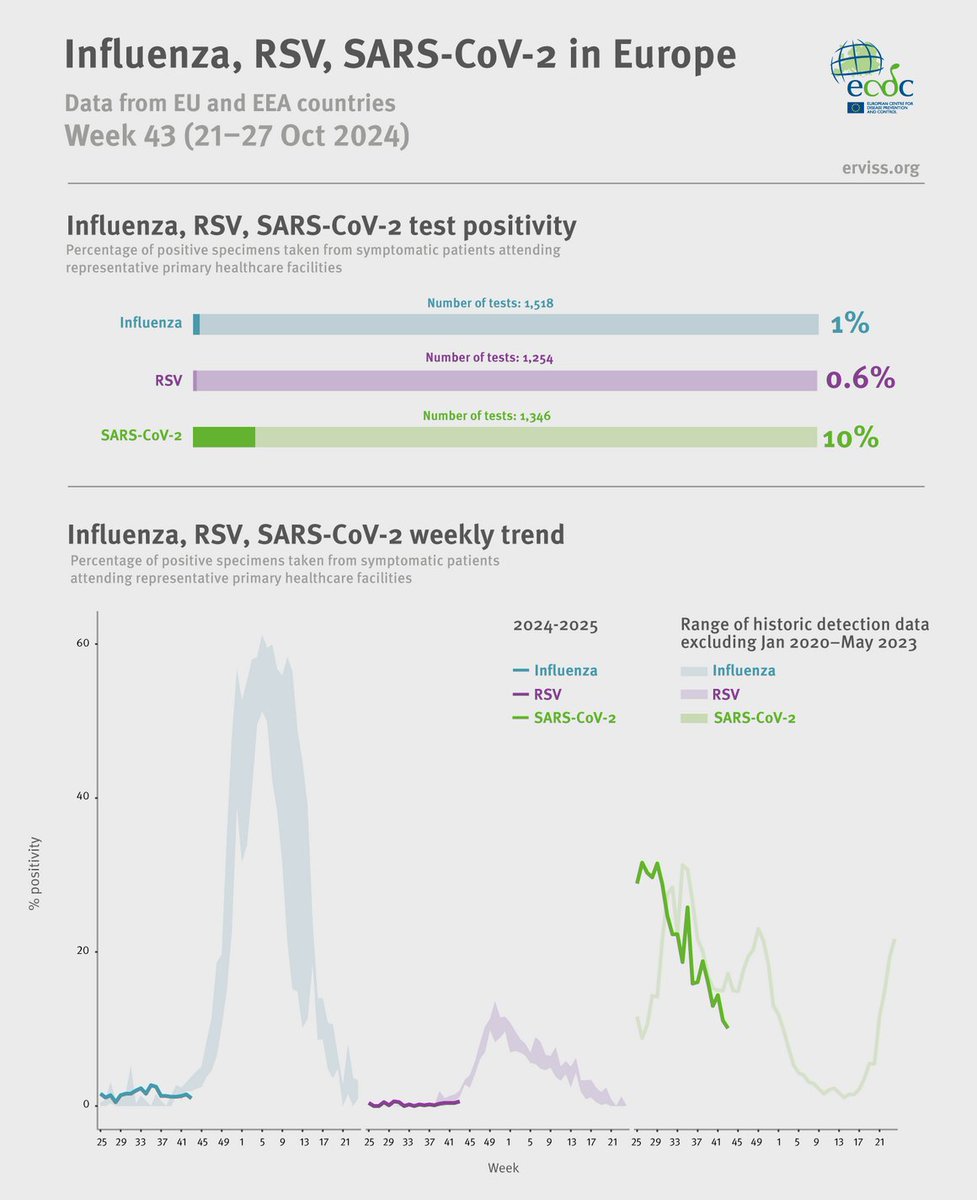
Activity of influenza viruses, respiratory syncytial viruses & SARS-CoV-2 remained at relatively low levels in week 43 in the EU/EEA countries.
Check out the improved https://t.co/tSt1J6hEko for weekly summaries on #flu, #SARSCoV2 & #RSV.