Day 25: An Interactive map for the #30DayMapChallenge@Zelbe04 created this map for her honours research project. The map visualizes rainfall🌧 data scraped from OpenWeatherMap and SAWS. The interactive map can be found here https://t.co/HzTjxrdOxA
Day 20 of the #30DayMapChallenge and today's challenge is to map Movement. Commercial Airliners🛩 trasport millions of people each year between different locations, which is why @Zelbe04 mapped the 10 busiest air routes in Africa based on the number of passengers transported.
Day 19: Islands. With South Africa going into the summer season it is interesting to see how the heat islands vary across the country on a summers day. ☀️
#30DayMapChallenge
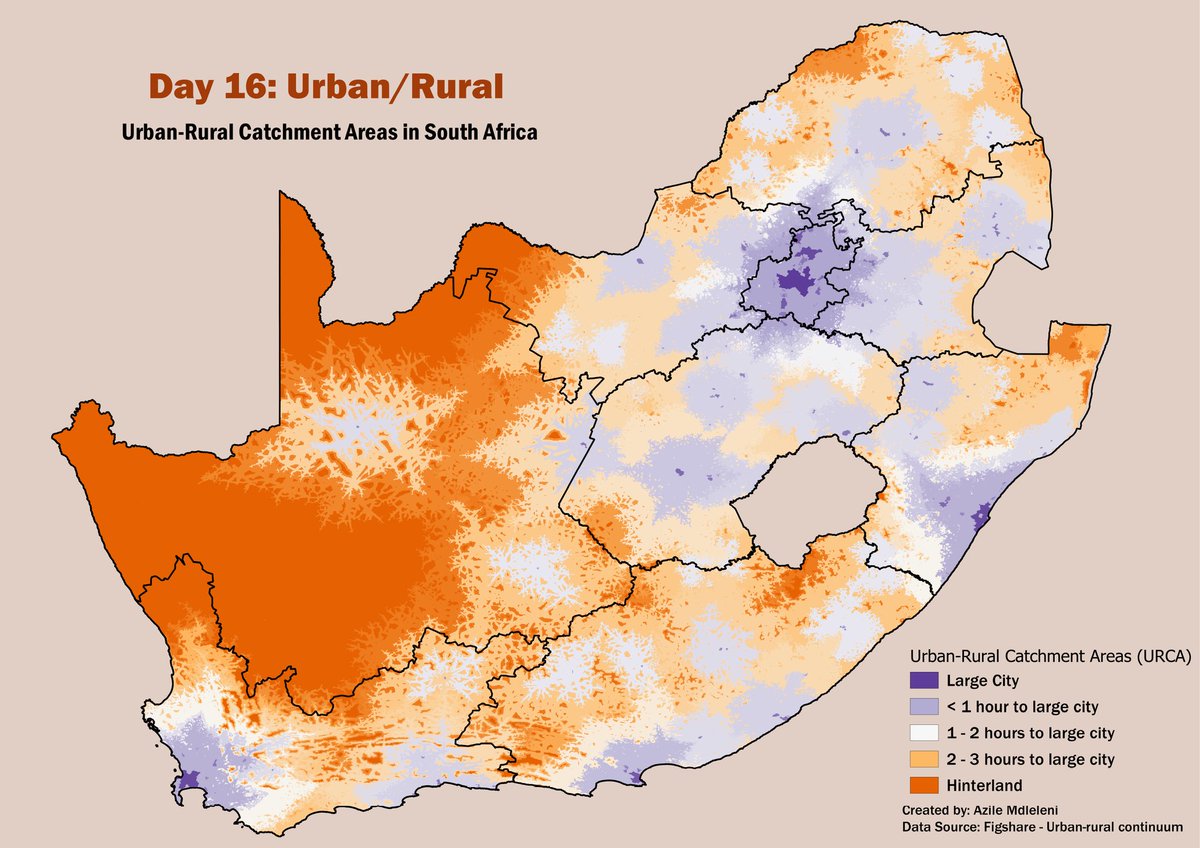
@GeotoZee 's map is of Urban-Rural Catchment areas - how far an area is from a large city (population > 5 million) based on travel time. Day 16 of the #30DayMapChallenge
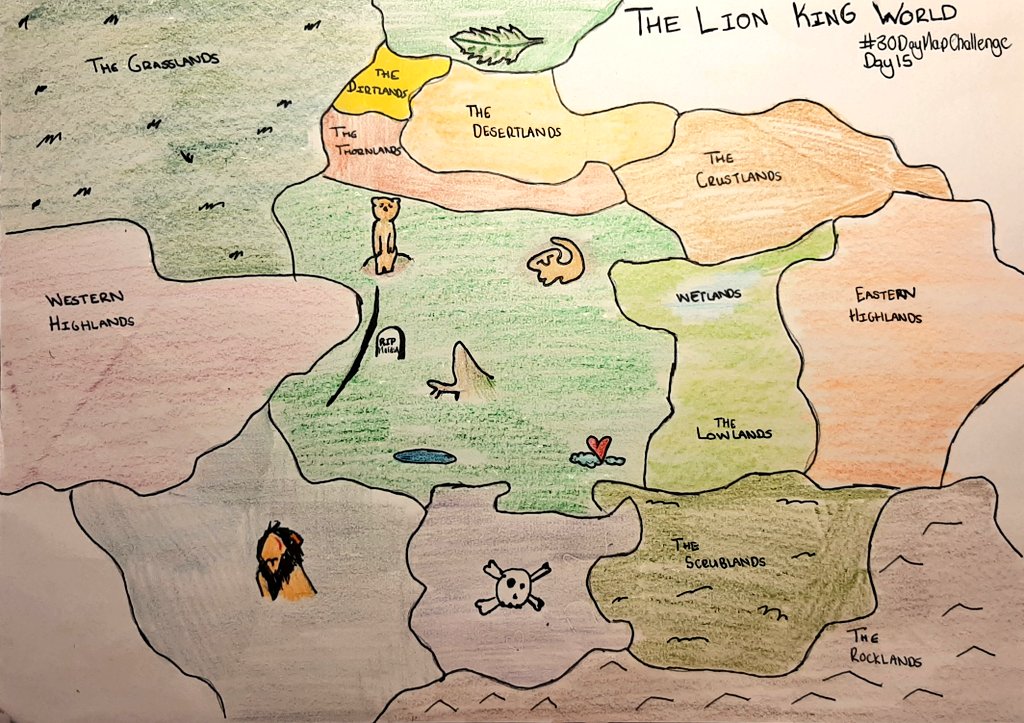
Day 15: Map made without using a computer. Today's map dives into the fictional world. @Zelbe04 drew a map of what she would imagine the Lion King World looks like 🦁. #30DayMapChallenge
Day 13 and Data challenge 2 of the #30DayMapChallenge . The challenge being using Natural Earth data. @terisha_pillay1 used the Bathemetry, rivers and shaded relief datasets. 🗺