Looking for quick, data-driven insights on agriculture, food, markets, and rural America?
Subscribe to receive Charts of Note by email and stay connected to the latest charts from USDA's Economic Research Service: https://t.co/eoBsaSpTZe.
Join our next Data Training Webinar on the Resource Requirements of Food Demand to learn how water, energy, and employment are used across the food supply chain—from farm to fork.
Register today: https://t.co/4XgGWCJZIq.
#NationalOliveDay. Eating olives and using olive oil in cooking and foods has been practiced for centuries, and consumption of olives and olive oils continues to increase in the U.S. -- especially with its associated health benefits. According to @USDA_ERS, California leads the nation in growing olives with about 70 percent of the state’s olive bearing acreage dedicated to olive oil production. Check out more from the USDA's Economic Research Service at: https://t.co/e7dzswyhOO
Data Update: Food Expenditure Series
Current and historical data that measures the U.S. food system, quantifying the value of food acquired in the U.S. by type of product, outlet, and purchaser.
Learn more: https://t.co/kOFE0hwBwe.
Join our next Data Training Webinar on the Resource Requirements of Food Demand to learn how water, energy, and employment are used across the food supply chain—from farm to fork.
Register today: https://t.co/4XgGWCJZIq.
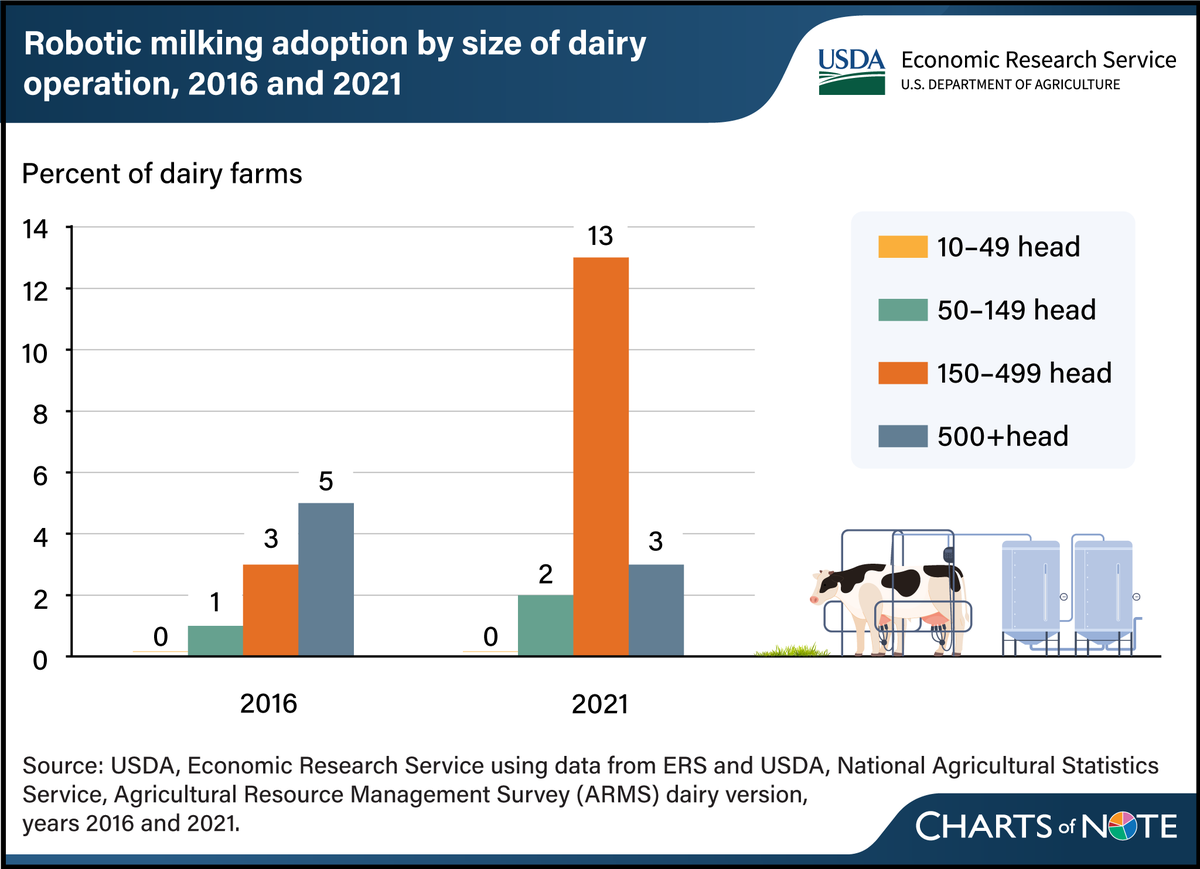
Interested in exploring ERS dairy data and how to use it?
Check out our Dairy Data Training Webinar for a walkthrough of per capita consumption trends, fluid milk sales, supply and demand data, and more: https://t.co/Aeyo7Ud1T2.
ERS analysis of 2000–2024 data shows that Single‑Family Housing received the largest share of @usdaRD funding, followed by electric, water, and business programs.
Follow this thread to learn more! 🧵
This report presents an overview of USDA's Rural Development investments, including a national profile of programs, their geographic distribution, and associations between RD investment and several key economic indicators.
For World Milk Day, here’s a look at where U.S. milk production is concentrated. In 2025, the top 5 milk‑producing States—CA, WI, ID, TX, and NY— produced over 50 percent of the nation’s annual milk supply.
Find more ERS dairy data and research: https://t.co/MeYzTNzqnT.
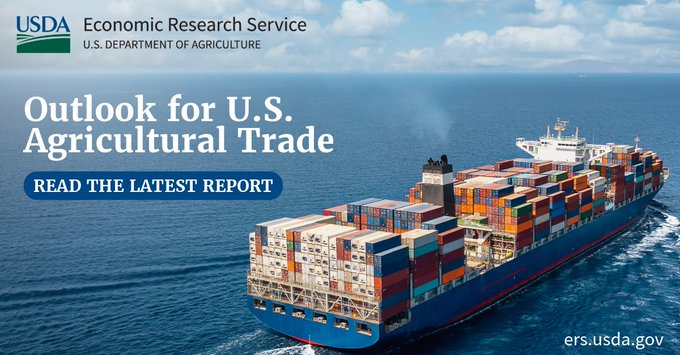
ERS’s Outlook for U.S. Agricultural Trade: May 2026 provides USDA’s quarterly forecasts for U.S. agricultural trade for fiscal year 2026. Learn more: https://t.co/hKVj720Upd.
Data Update: Agricultural Exchange Rate Data Set
The Agricultural Exchange Rate Data Set contains annual and monthly data for exchange rates important to U.S. agriculture. Learn more: https://t.co/DdOTC6L7bA.
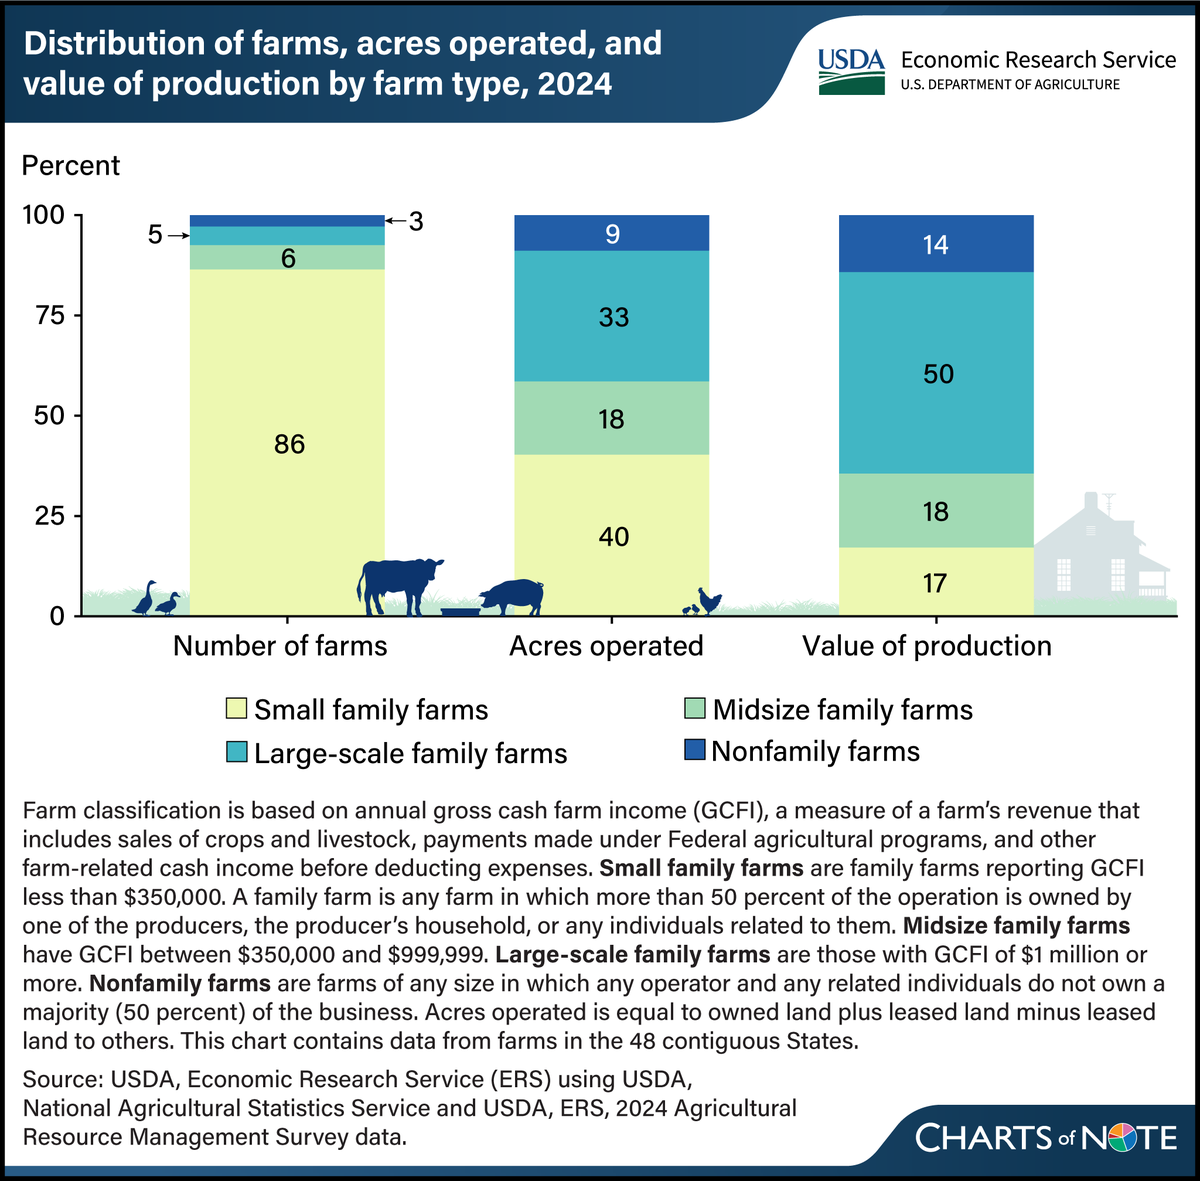
Small family farms accounted for 86 percent of U.S. farms and generated 17 percent of the value of production in 2024.
Learn more in this Chart of Note: https://t.co/GTL8izfNL9.
Data Update: Livestock and Meat Domestic Data
Current and historical data on pork, beef, veal, and poultry, including production, supply, utilization, and farm prices. Learn more: https://t.co/aiIevX2DJQ.
ERS's Food Price Outlook provides food price data and forecasts changes in the Consumer Price Index (CPI) and Producer Price Index (PPI) for food.
See the May 2026 forecast summary findings: https://t.co/TdVKkMnCEa.