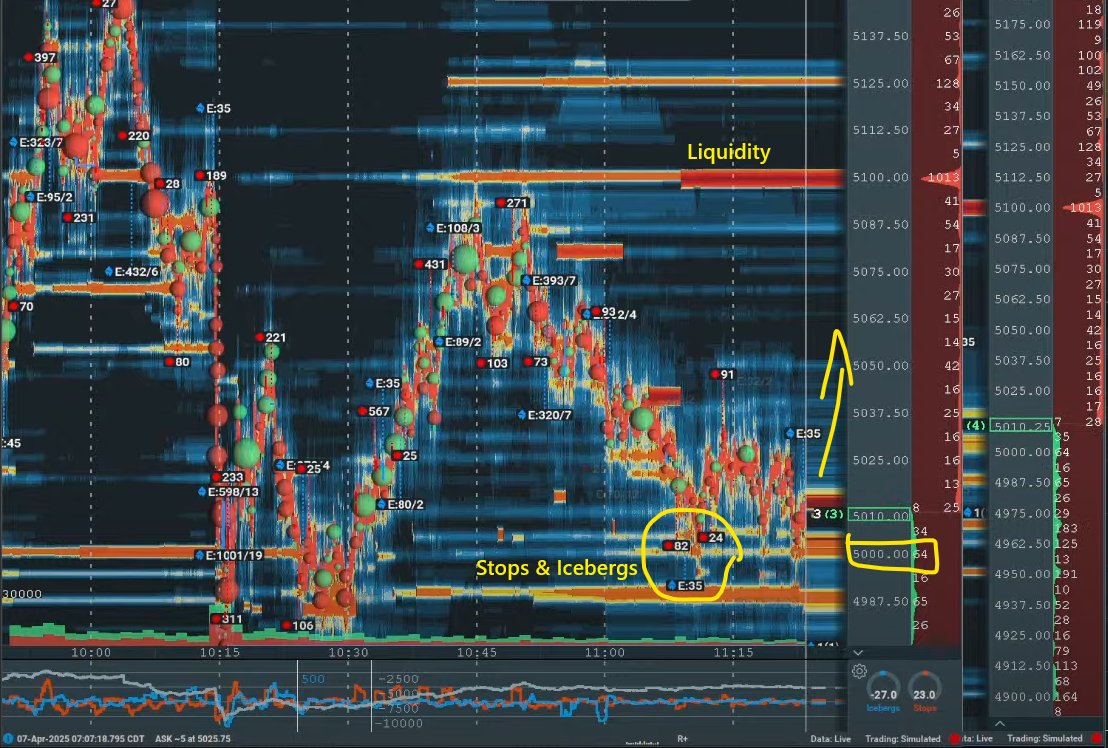
The S&P 500 (ES) is currently testing the 5,000 level, reflecting the volatility triggered by trade tensions. Could we be seeing a potential bounce? #bookmap@bookmap_pro
Bitcoin manages to recover 80K with Aggressive Buying (Sellers' stop loss) at the level, liquidity appeared around 87K, but we believe it's still too early to celebrate.📈#bookmap@bookmap_pro
Spot key absorption zones and icebergs for your trades. High liquidity (yellow) and absorptions (circle) reveal hidden opportunities📈#bookmap@bookmap_pro
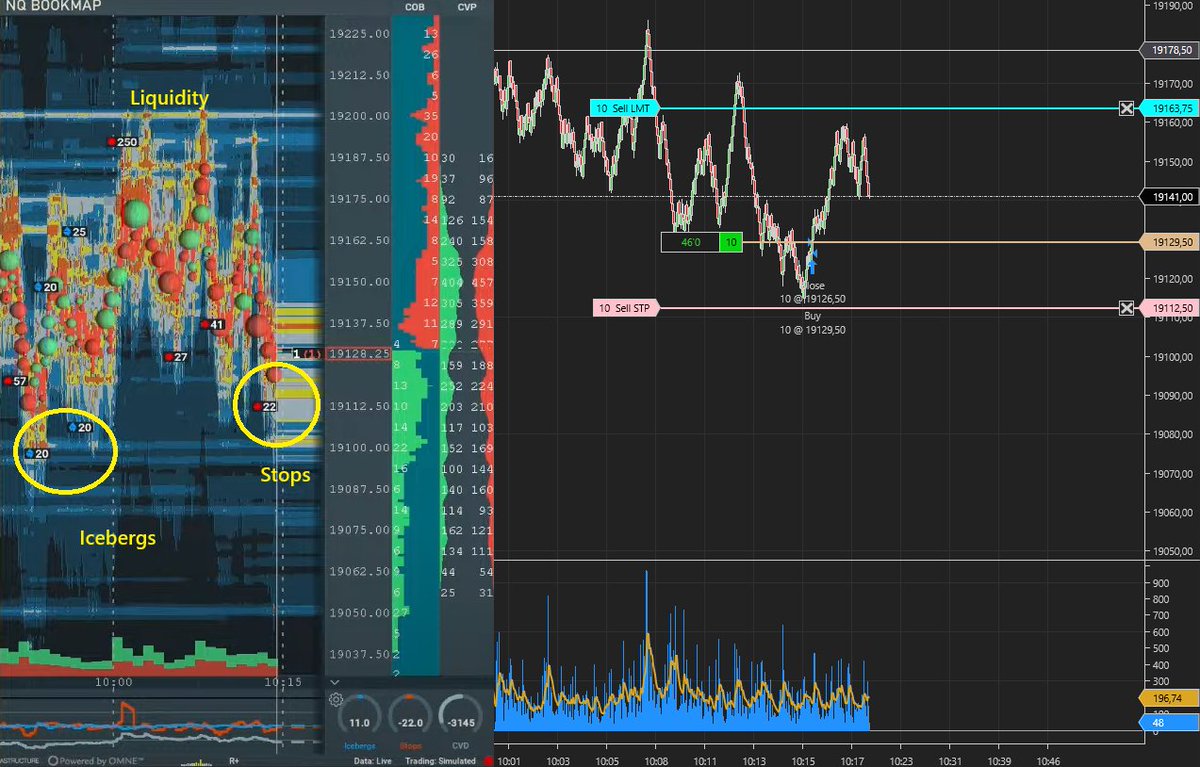
Check out how 'Iceberg' and 'Stops' indicators bring this Nasdaq 100 chart to life! 'Iceberg' reveals large orders split to hide size, while 'Stops' mark key risk levels. Is this stealth accumulation or disguised distribution? Let me know your thoughts! 📈#bookmap@bookmap_pro