Rate hikes always mean a drop? Easy money always means a rally? Is Bitcoin digital gold?
Using weekly data from July 2010 through September 2026, we tested the ten claims retail investors hear most often. Some are only half right. Others point in the wrong direction entirely.
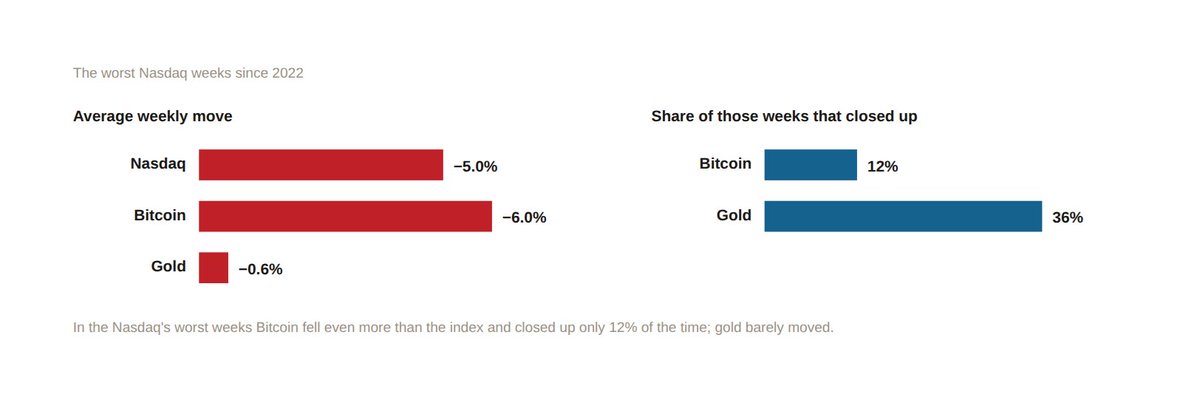
The most counterintuitive finding: in the worst weeks for U.S. equities, Bitcoin fell 6.0% on average, while the Nasdaq fell 5.0%. It is not a safe-haven asset.
Ten questions, below.One-line conclusion: macro governs Bitcoin’s “pace and risk,” not its “direction.” What actually sets the broad direction is Bitcoin’s own cycle.
Three core findings first:
1/ Bitcoin “hooked up” to macro in two steps
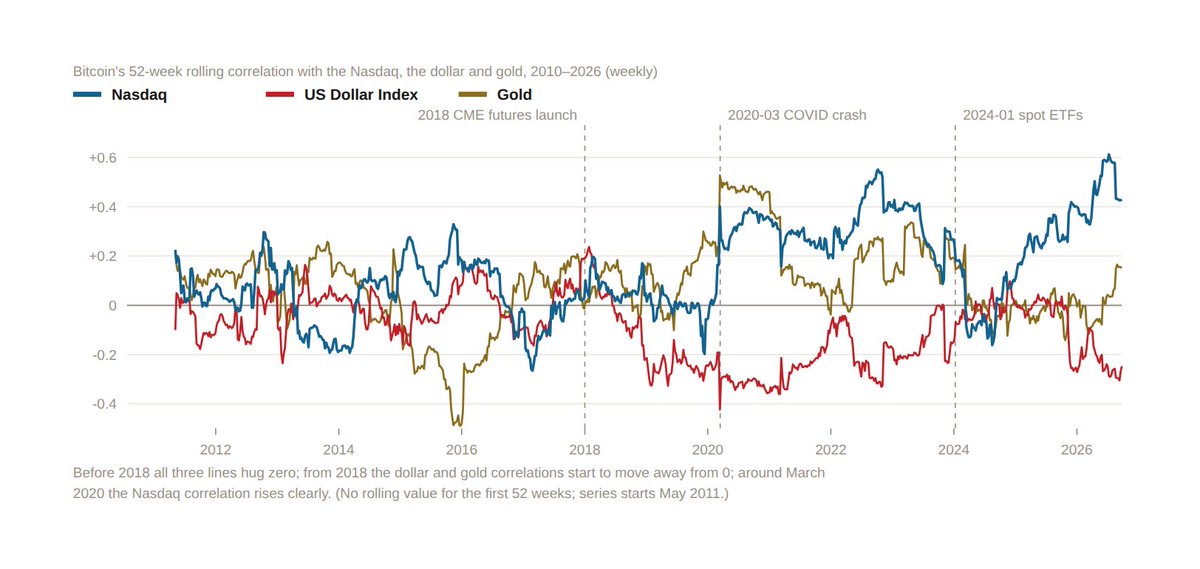
Before 2018, macro barely moved it. After CME futures launched in 2018, it started moving with the dollar and gold. After market cap held above $100 billion in March 2020, it started rising and falling with the Nasdaq.
2/ Macro explains only a small share
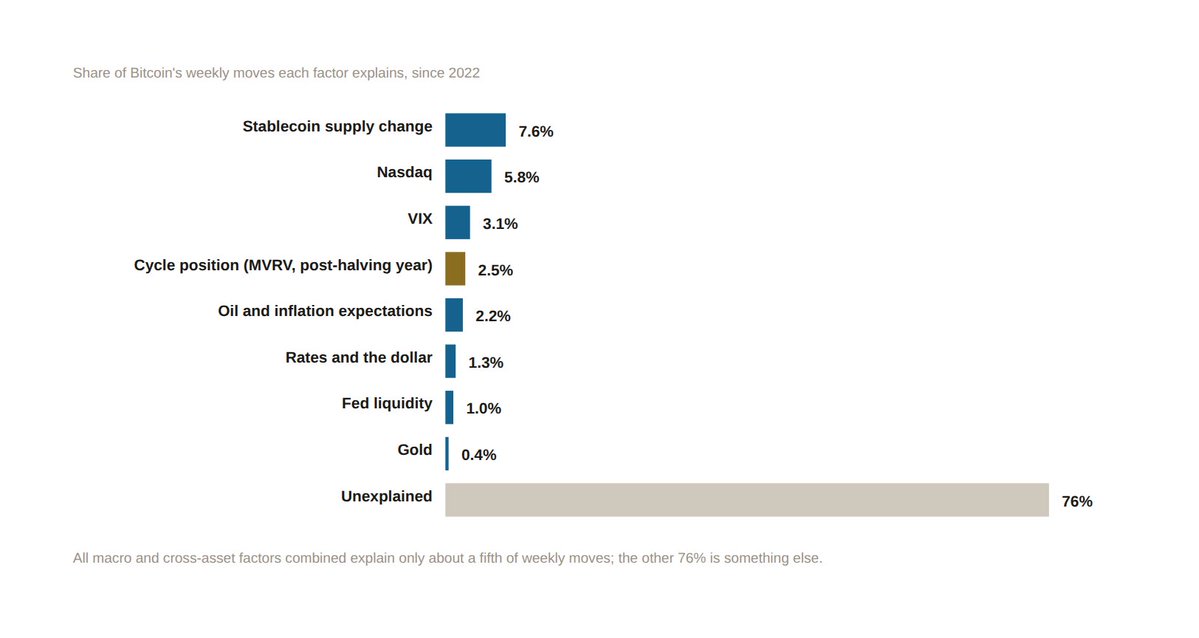
Since 2022, 76% of Bitcoin’s weekly moves cannot be explained by macro. Monthly explanatory power rises to 58%, but adjusted it is only 46%. Shuffling the data 500 times, the same model still produces about 38%.
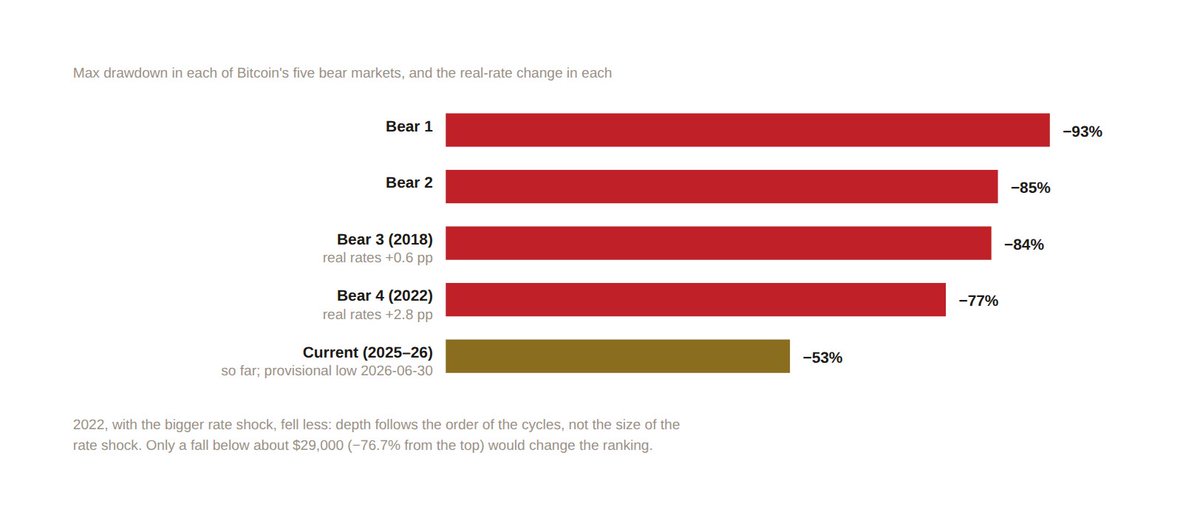
3/ Direction follows the cycle; pace follows macro Five bear markets fell −93%, −85%, −84%, and −77%; this one is −53% so far, in line with cycle order, not with the size of the rate shock.
Rates rose 2.8 percentage points in 2022 and only 0.6 in 2018, yet 2022’s drawdown was shallower.
The ten questions retail investors ask most:
Q1. Do rate hikes always mean a drop? Only half true. Sharp rate rises plus widening credit: Bitcoin’s 13-week median was −27%. Sharp rate rises with credit tightening: only −3%. The real danger is whether credit is loosening.
Q2. Does liquidity lead Bitcoin by 2–3 months? No. The “0.94 correlation” between M2 and BTC is spurious; the correlation of changes is only 0.08. Of 14 lead-lag relationships tested, only one held up.
Q3. Is Bitcoin a safe haven? No. In the worst weeks for U.S. stocks, the Nasdaq fell 5.0% on average and BTC fell 6.0%, finishing up in only 12% of those weeks. Gold fell just 0.6% over the same periods. BTC falls with equities; it does not rise with them.
Q4. When gold makes new highs, does money spill over? No stable evidence. In one year gold rose 81% while Bitcoin fell 14%.
Q5. Is a stronger dollar bearish? Directionally yes, but weakly. Weekly correlation −0.15; explanatory power under 1%.
Q6. Do ETF inflows mean institutions are bullish? ETFs chase momentum. Same-day net inflows correlate 0.60 with the prior 3 days’ move, and only 0.04–0.07 with the next 1–10 days. In the 20% of weeks with the largest outflows, BTC fell another 3.5% on average over the following 4 weeks—not a buy-the-dip signal.
Q7. Does stablecoin growth mean new money is coming in? Price rises first; stablecoins grow later. Transactional stablecoins (excluding Tron) are down about $7.5 billion (−4.2%) over the past year and about $4.6 billion over the past quarter.
Q8. ETFs are buying and stablecoins are shrinking—who is selling? Over the past 13 weeks, ETF net inflows were about $5.96 billion while transactional stablecoins (excluding Tron) fell about $4.56 billion: mostly existing-capital rotation, not new money entering.
Q9. Was the 2022 crash caused by rate hikes? Hikes were an amplifier, not the root cause. The cycle was the root cause. Rate hikes contributed roughly 31–37% via the drag on U.S. equities; crypto’s own credit events (LUNA, Three Arrows, FTX) contributed about 54%.
Q10. How should you trade on FOMC day? The same first hike was followed by +71% over the next 12 months in one case and −39% in another. The same cut was followed by +64% over the next 3 months (September 2024) and −26% (September 2025). On meeting day, adjust position size only—don’t use it to call direction.
Where things stand now (as of September 30, 2026)
Neutral to cautious; stay alert. The Fed hiked again on September 16. The 10-year real yield is 2.93%, the highest since 2008. Equities look optimistic (Nasdaq 100 +4% over a quarter, VIX at 16), but high-yield spreads widened nearly 0.5 percentage points in one week in late September. ETFs are seeing inflows while transactional stablecoins (excluding Tron) are contracting.
Signals that would turn this into a headwind: corporate bond spreads or the financial conditions index tightening over a quarter, or the Nasdaq turning down over a quarter with the VIX above 20.
This is research sharing, not investment advice.
Full PDF report link is in the comments; download and save it.
【Hot Coin Desk · Issue 41 (2026-10-28)】
$BTC is still chopping around 80,000 (reportedly). I'm not opening a new trade today.
The reason is simple. I have no trading basis today that supports placing an order. Without a basis, I don't place orders and I don't touch anything else.
The market is arguing over how to read the same move. BTC went from around 79,500 (reportedly) back to around 81,500 (reportedly). Bulls say holding this support plus short liquidations confirms the rebound. Bears say it is only temporary support, and a hawkish Fed could push it lower. Both sides point at the same price move and reach opposite conclusions. The rate decision that tests them best is set for Oct 28, and there is no result yet. So "the rebound is confirmed" is still just a claim today, not a fact.
US spot BTC ETFs recorded about $110 million in net inflows (reportedly) on Oct 26 to 27, ending a streak of outflows. I know that sounds like a turn. But one day of inflows only ends the outflows. It is not a trend yet, and it is not a reason for me to trade. The sentiment index is also only near neutral, which tells me people are waiting.
When I do have a trade, I set the stop at entry based on the daily close. My maximum loss is fixed at that moment. A wick is just a loss I've already priced in, not a blown account.
After the rate decision, I'll watch whether the BTC daily close holds 80,000 (reportedly). Then I'll decide if there is a basis to trade. Is your stop set before you place the order?
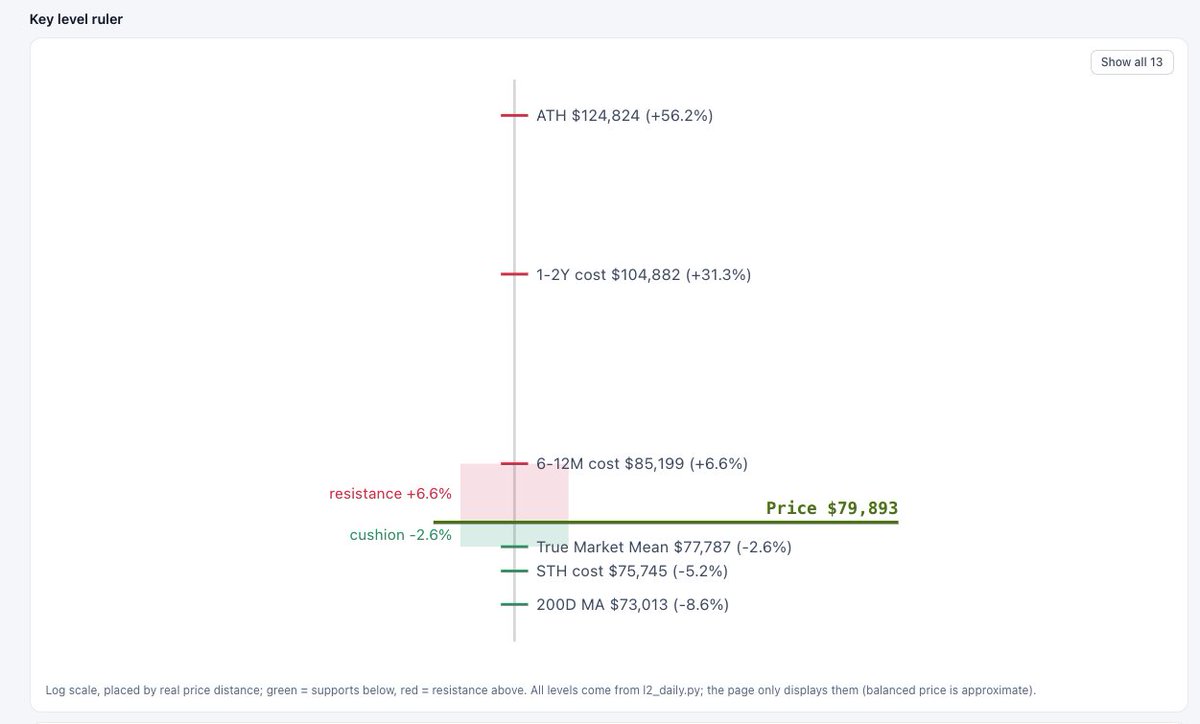
The STH realized price is at $75,745, True Market Average at $77,787, and the 200DMA at $73,013—all serving as solid support below. Meanwhile, $85,000 sits as a heavy overhead resistance. Considering the average cost for ETF buyers is around $79,000, the tug-of-war between bulls and bears is hitting a peak.
Given these technical constraints, the immediate outlook points toward a tight, range-bound consolidation. On-chain data also confirms we’ve entered a cooling-off phase. Historically, this type of consolidation lasts anywhere from 1 to 7 days as liquidity sits on the sidelines waiting for major catalysts to unfold—all trailing into next week’s mid-term elections.
Now is the time to prioritize strict position management for any short-term bets.
【Hot Coin Desk · Issue 40 (2026-10-26)】
The 80,000 level broke last night and got pulled back. The argument is whether that was a shakeout or the market turning weaker. I am not opening a new trade today.
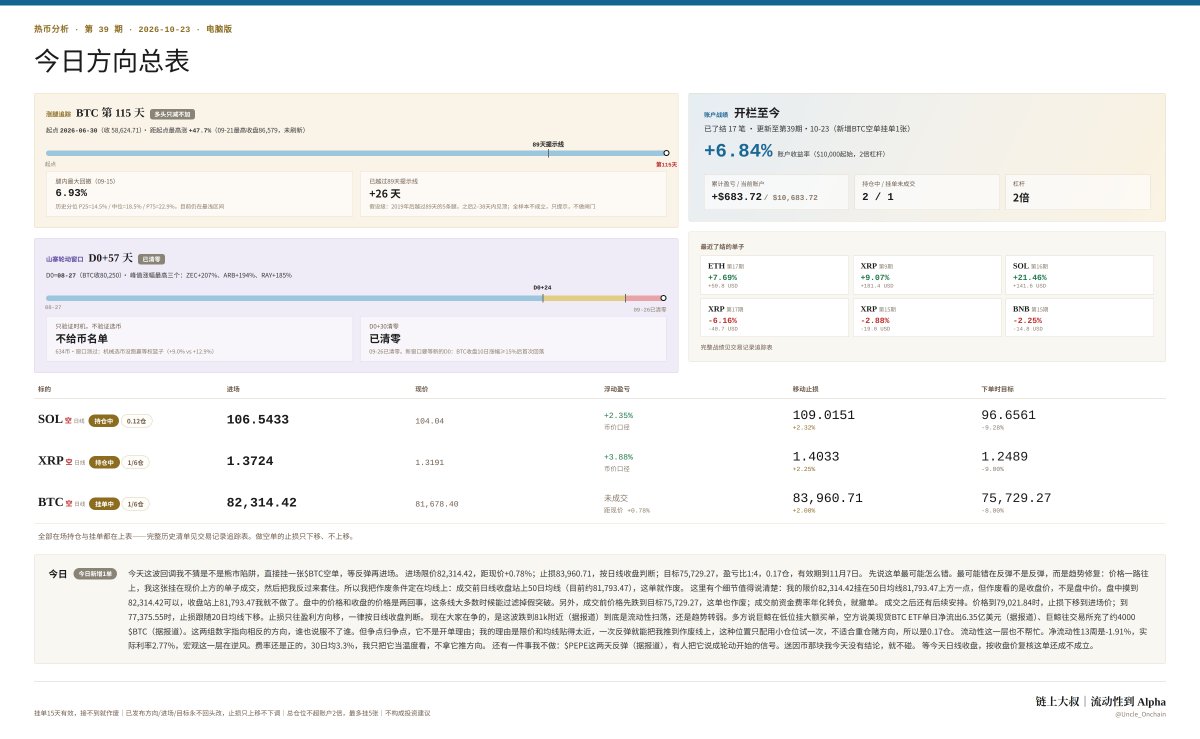
Let me lay out the books first. 17 closed, +$683.72 total, account return +6.84%, updated through Oct 23. Of those 17, 6 were winners and 11 were losers. The largest single loss was -$235.6, and I have not deleted one losing trade. They are all in the public ledger. Right now I have 2 positions on and 1 order working.
Put those two numbers together: losers outnumber winners by nearly two to one, and the account is still positive. That is the only basis I have for answering "could this go to zero overnight." The -$235.6 max loss was a ceiling I set before I entered, not something the market decided for me. If a wick takes out my stop, that is a loss I already counted, not the account going to zero.
The most recent close was $ETH, up +7.69% on price, +$50.8 on the account. In the same batch there was XRP +$181.4 and SOL +$141.6. I report the latest closed batch, not just the winners. The 11 losers above stay on the table too.
No new trade today because the ledger already has 3 short positions in majors, which hits my same-direction cap. I have one each on BTC, SOL and XRP in the market, and I do not stack duplicates. The rule blocked it first. It was not me deciding on the spot that the tape looked bad.
The hot debate is whether BTC 80,000 is real support. One side points to about $301 million in weekly net ETF inflows (as reported) and says a pullback is a chance. The other says longs just got liquidated hard and there is more room below. I listen to both, but both are opinions, not a reason to open a trade. However loud the direction debate gets, I still need a slot to place an order. If the same-direction cap has not loosened, the best-sounding logic still cannot become a trade.
ZEC has come up again the past couple of days. Price is above the 200-day moving average and the trend is intact. A big move up is not by itself a reason to short. It needs a specific piece of bad news, and I do not have one, so I am staying out.
The next review point is the daily close after the Oct 28 Fed meeting, to see whether BTC holds 80,000.
One last line: what decides whether an account survives is not how many times you are right, but whether your losing trades stay inside the number you wrote down before you entered. Your last loss: was it a number in the plan, or did you only find out how much it hurt afterward?
最近发现我的帖子怎么全是交易的,内容太枯燥了,难怪没人看。我计划将每日交易计划专业内容放到TG频道去了,推特只保留跟踪链上热门项目追踪和alpha分析挖掘。
最近主要在搭建我的投研工作台网站 ,进度有一半了,我预感到弄完了会非常牛,相当于一个自动化分析团队在给我服务。
PS:频道和个人网站见主页
Realized my timeline has turned into a dry trading log. Moving all daily trade setups and execution plans over to Telegram, and keeping X strictly for on-chain trending project tracking and alpha breakdowns.
Also halfway through building my custom dashboard/workspace—it already feels like having an automated research team working 24/7.
PS. TG & site links in bio.
#onchainanalysis
【Hot Coin Desk · Issue 39 (2026-10-23)】
I'm not guessing whether today's pullback is a bear trap. I'm just placing a $BTC short and waiting for a bounce to enter.
Entry limit 82,314.42, +0.78% from the current price. Stop 83,960.71, judged on the daily close. Target 75,729.27, risk-reward 1:4, 0.17 size, valid until Nov 7.
First, how this trade most likely goes wrong. It most likely goes wrong if the bounce isn't a bounce but a trend repair: price keeps grinding up, the order I've placed above the current price fills, and then I'm the one trapped. So I set the void condition on the moving average: if the daily close gets above the 50-day moving average (currently about 81,793.47) before the fill, the trade is void.
One detail worth spelling out here: my limit at 82,314.42 sits a little above the 50-day moving average at 81,793.47, but the void condition reads the close, not the intraday price. Touching 82,314.42 intraday is fine. If it closes above 81,793.47, I don't take it. Intraday price and closing price are two different things, and most of the time that line filters out fake breakouts. Also, if price drops to the target 75,729.27 before the fill, the trade is void too. And if the funding rate annualized turns negative before the fill, I cancel.
After the fill there's a follow-up plan. At 79,021.84 I move the stop down to the entry. At 77,375.55 I trail the stop down with the 20-day moving average. The stop only moves in the profitable direction, always judged on the daily close.
What people are arguing about right now is whether this drop to around 81k (reported) is a liquidity sweep or a trend turning weak. The bulls say whales are placing large bids at lower levels. The bears say US spot BTC ETFs saw a single-day net outflow of $635 million (reported), and whales sent about 4000 BTC to exchanges (reported). Those two sets of numbers point in opposite directions, and neither side can convince the other. But the argument isn't why I'm taking the trade. My reason is that the limit and the moving average sit too close together — one bounce can push me onto the void line. That kind of spot only deserves one small position, it's not right for a big bet on direction, so it's 0.17 size.
Liquidity isn't helping either. Net liquidity over 13 weeks is -1.91%, real rates are 2.77%, so the macro layer is a headwind. Funding is still positive, 3.3% on a 30-day average. I only read it as a temperature gauge, not as a direction call.
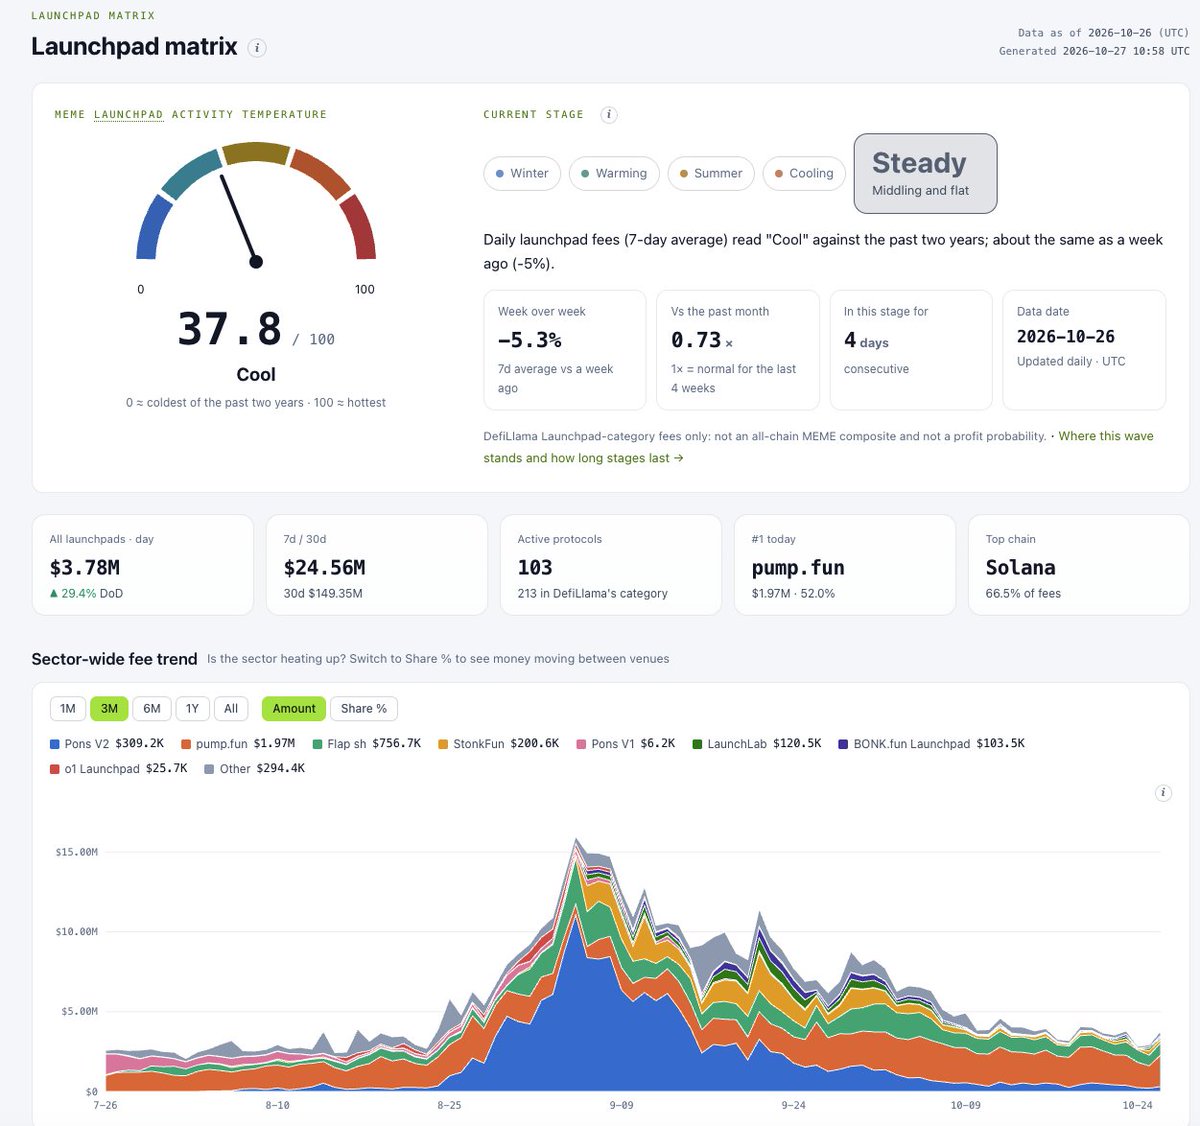
One more thing I'm not doing: PEPE bounced these two days (reported), and some people are calling it the start of rotation. I have no conclusion on memecoins today, so I'm not touching it.
I'll wait for today's daily close and re-check with the closing price whether this trade still stands.