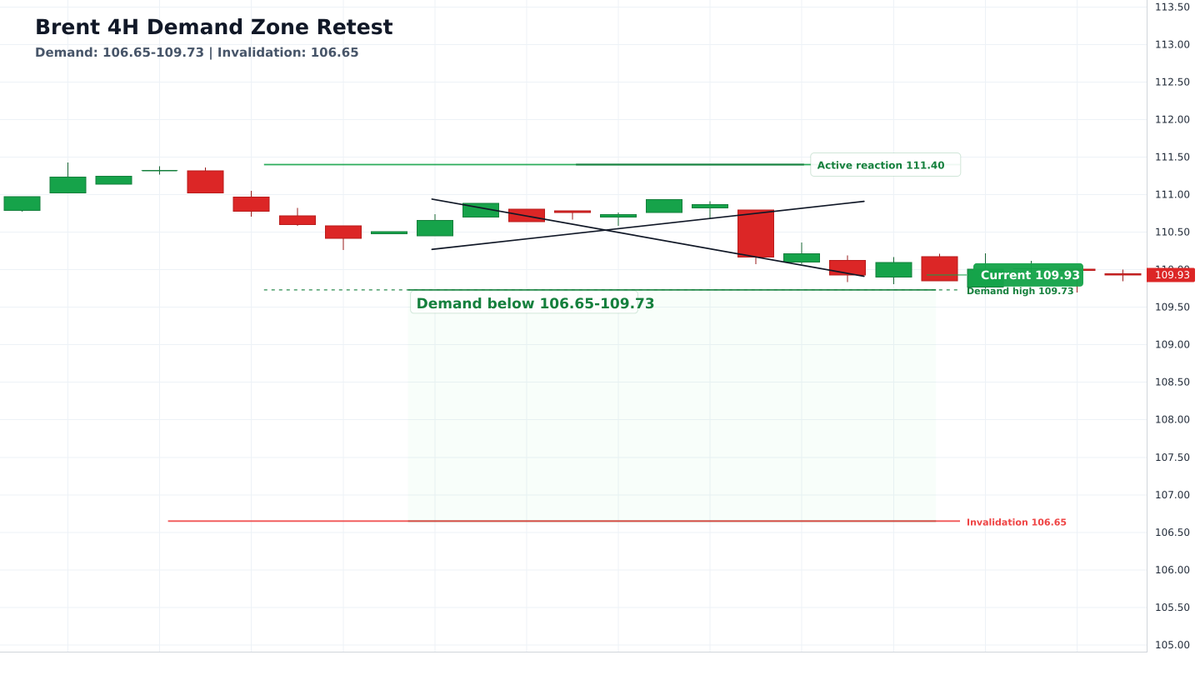
I publish daily WTI & Brent 4H case maps.
Each map includes:
- Demand zone
- Bull trigger
- Bear invalidation
- Key support/resistance
- Post-market outcome review
Just conditional market structure, tracked over time.
Follow if you want oil market maps with receipts.
Follow-up to the r/oil discussion:
The 7.9mb EIA draw supports physical tightness, but WTI still needs to reclaim 99.43 / 101.65 on the 4H chart.
Until then, 95.11-98.89 remains the key supply zone.
#USOIL#WTI#CrudeOil TradingView https://t.co/HiNC7TTQj5
USOIL 4H scenario map:
Demand zone: 96.47-101.57.
Price remains constructive while the zone holds.
A confirmed break above 101.57 would support continuation; a close below 96.47 weakens the map.
https://t.co/blLdjgbyPJ #WTI#CrudeOil#OilTrading#Commodities#EnergyMarkets
BRENT 4H scenario map:
Price is holding around the demand zone at 105.87-109.73.
Bull case: reclaim/hold above the zone and test recent highs.
Bear risk: close below 105.87 weakens the setup.
https://t.co/HXHBnNyzFi #OOTT#WTI#CrudeOil#brent
My view: headline stocks matter, but Cushing, refinery runs, cracks, and export flows decide whether the market is actually comfortable.
The setup still looks like a fragile equilibrium, not a clean bearish inventory rebuild.
Posted this crude oil inventory framework on Reddit and got ~21K views.
Core question:
Are inventories really rebuilding, or is the market still tight once you separate national stocks from Cushing, refinery runs, and export flows?
https://t.co/6FkwOqinPX
#OOTT#WTI#CrudeOil
Track source: https://t.co/k2CTb2piei
Evidence:
EIA weekly crude stocks for week ending 2026-05-01: 849.9 million barrels.
This is a scenario map, not a prediction.
Educational only. Not financial advice.