Rupee at a Critical Turning Point | Weakness Near Exhaustion?
The recent move in USDINR clearly reflects gradual rupee weakness, but the charts are now signaling that we are approaching a major exhaustion zone near 95–96.
From a price action perspective, the market has completed a strong impulsive structure and is now nearing the upper boundary of a rising channel, which historically acts as a supply zone.
Technical Confluence at 95–96 Zone:
Elliott Wave suggests Wave (5) maturity
Fibonacci extensions (1.33 – 1.618) aligning near 95–96
Price stretched above key moving averages → overextension
Momentum indicators (RSI near upper band, MACD flattening) → loss of strength
This clearly indicates that smart money may start distribution in this zone.
What Next?
If USDINR sustains rejection near 95–96, we can expect a corrective phase in the coming weeks.
Downside Targets (Rupee Strengthening):
First Support: 93.00 – 92.50
Key Demand Zone: 91.80 – 90.00
Extended Move: 88.00 Zone
Markets don’t reverse randomly.
They reverse where:
1. Retail panic peaks
https://t.co/NtUnMve7r0 money distributes
3.Technical confluence builds
And right now… 95–96 is that zone.
Strategy View
Avoid chasing USDINR longs near 95–96
Watch for reversal confirmation / rejection patterns
Rupee weakness may be near exhaustion, and a counter-trend move towards 90–88 cannot be ruled out.
Vikash Bagaria
SEBI Registered Research Analyst – INH300008155
BSE Enlistment No – 5426
Investment in securities & commodities market are subject to market risks. Read all the related documents carefully before investing.
Registration granted by SEBI, membership of BASL and certification from NISM in no way guarantee performance of the intermediary or provide any assurance of returns to investors.
The securities & commodities quoted, if any, are for illustration only and are not recommendatory.
The information provided is for educational and informational purposes only and should not be considered as an offer, solicitation, or recommendation to buy or sell any financial instruments.
Past performance is not indicative of future results.
We do not guarantee any assured returns or profit in the market. All trading and investment decisions are subject to individual risk tolerance.
For detailed disclaimer, please visit:
https://t.co/oynCuD1KM9
#USDINR #Rupee #IndianRupee #ForexIndia #CurrencyTrading #ForexMarket #DollarRupee #INRAnalysis #ForexTrading #CurrencyMarket
I Had the Opportunity I had the privilege of joining Aashish Sir @AshVerma111on CNBC TV Awaaz @CNBC_Awaaz to discuss & Share my Strategy on #aluminium & #NaturalGas.
A big thank you to CNBC TV Awaaz & Aashish sir for having me on the show.
Disclaimer :- VIKASH BAGARIA SEBI Research Analyst INH300008155, BSE Enlistment No-5426 “Investments in Securities market are subject to Market Risks, Read all the related documents carefully before Investing.” Registration granted by SEBI & Certification from NISM in no way guarantee performance of the intermediary or provide any assurance of returns to Investors. For Research Risk & Disclosure Please Visit https://t.co/CzWXOHgsx8
@PrabhatJai43900@Ashish_4vedi Asish ji is doing a great job to inform people and take informed decisions, and you don't have the right to use abusive language for him, if you don't like his updates you can just unfollow him, but Don't use abusive language
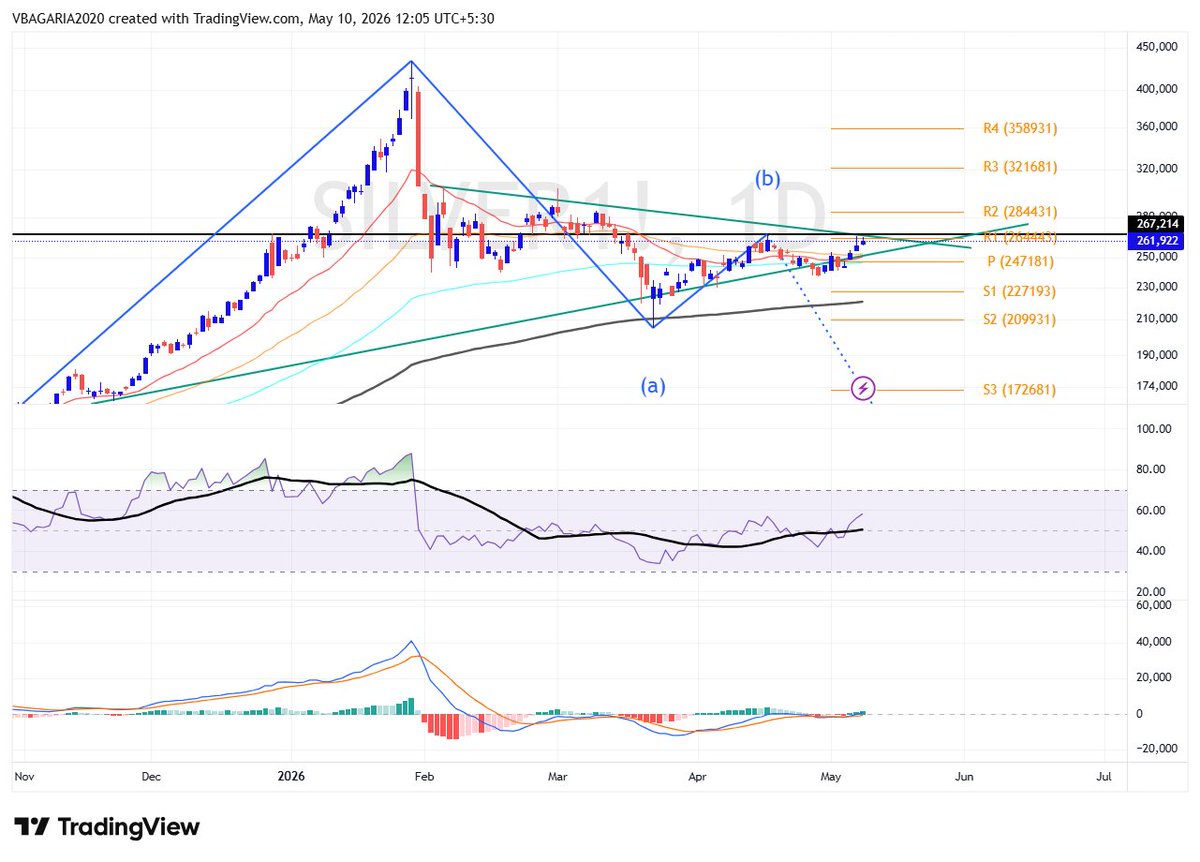
SMART MONEY ROTATION ALERT ⚡️
Geopolitics and charts are aligning for a major shift:
👉 US-Iran Deal is nearing the finish line.
👉 Crude is topping out on heavy distribution—the energy rally is exhausted.
👉 Silver has quietly bottomed out and is coiled for an asymmetric move.
Institutional funds are already rotating out of oil and into silver. Position accordingly.
I had the privilege of joining Aashish Sir
@AshVerma111 on CNBC TV Awaaz
@CNBC_Awaaz
to discuss Copper & Crude oil important levels, trend direction. A big thank you to CNBC TV Awaaz & Aashish sir for having me on the show.
Disclaimer :- VIKASH BAGARIA SEBI Research Analyst INH300008155, BSE Enlistment No-5426 “Investments in Securities market are subject to Market Risks, Read all the related documents carefully before Investing.” Registration granted by SEBI & Certification from NISM in no way guarantee performance of the intermediary or provide any assurance of returns to Investors. For Research Risk & Disclosure Please Visit https://t.co/CzWXOHgsx8
Is Gold & Silver Preparing for a Major Breakout?
Global markets remained on edge this week as geopolitical tensions once again intensified.
The ongoing uncertainty surrounding the U.S.-Iran conflict and fresh concerns over the Strait of Hormuz have increased safe-haven demand globally. Any disruption in this key shipping route could trigger higher oil prices, inflation concerns, and risk-off sentiment across global markets.
But here’s what caught my attention:
Despite major geopolitical headlines, Gold and Silver have not seen aggressive selling pressure.
This often indicates that institutional participants may be accumulating at lower levels.
MCX Gold Outlook
Gold continues to hold above the critical 1,48,000���1,50,000 support zone.
Repeated buying at lower levels suggests strong institutional demand.
From a technical perspective:
• Price holding near 20 EMA
• 50 EMA acting as immediate support
• 200 EMA trend remains bullish
• RSI improving
• MACD nearing bullish crossover
• Elliott Wave structure still indicates possible Wave (5) expansion
Upside Targets: 1,60,000 → 1,76,000
MCX Silver Outlook
Silver continues to hold above its key support zone of: 2,30,000–2,40,000
The current price structure suggests volatility compression before a potential breakout move.
If Silver sustains above: 2,65,000
Potential targets could be: 2,75,000 → 2,90,000
My Strategy
Gold: Buy on dips near support zones
Silver: Watch breakout above 2,65,000
Risk management remains critical in such volatile conditions.
Final Takeaway
Current weakness appears to be consolidation—not trend reversal.
If geopolitical tensions escalate further and the dollar weakens, precious metals could witness their next major move.
Sometimes charts start speaking before headlines do.
What’s your view on Gold & Silver this week?
#Gold #Silver #MCX #CommodityMarket #Trading #TechnicalAnalysis #GoldTrading #SilverTrading #Commodities #Investing #MarketAnalysis #Geopolitics #PreciousMetals #VikashBagaria
Vikash Bagaria
SEBI Registered Research Analyst (INH300008155)
BSE Enlistment No. 5426
The securities and commodities quoted in this article are for illustration purposes only and are not recommendatory.
Investments/trading in securities market are subject to market risks. Read all the related documents carefully before investing/trading.
For complete disclaimer, please visit: https://t.co/CzWXOHgsx8
"Gold traders dhyan do... iss week gold ek aise level par khada hai jahan se ya toh bada breakout aa sakta hai... ya sharp correction. COMEX aur MCX dono charts ek rare signal de rahe hain... aur smart money ki activity bhi visible hai."
https://t.co/dXGbmAeYiS
Vikash Bagaria
SEBI Registered Research Analyst – INH300008155
BSE Enlistment No – 5426
Investments in securities & commodities markets are subject to market risks. Read all related documents carefully before investing.
The securities quoted are for illustration only and are not recommendatory.
Please refer to disclaimer on website: https://t.co/oynCuD1KM9
Crude Oil has formed a structural top at 10,600 following a completed 5-wave Elliott cycle and a bearish Daily "M" pattern. The technical breakdown points toward a correction target of 7,100.
Kya Hormuz open hone wala hain??
Well charts are bearish and i believe a positive news is on the way!!
The securities & commodities quoted are for illustration only and are not recommendatory. Investments in securities and commodities are subject to market risks. Please review all related documents carefully before investing.
Vikash Bagaria
SEBI Registered Research Analyst – INH300008155
BSE Enlistment No – 5426
Please refer to the disclaimer on the website:
#crudeoil
Is the Crude Oil Bull Run Over? A Deep Dive into the Technical "Triple Top" Structure.
The charts are speaking, and they’re whispering (actually, shouting) one word: Exhaustion.
After a relentless rally, Crude Oil is hitting a massive wall of resistance. By aligning the Monthly, Weekly, and Daily timeframes, we see a textbook case of a structural top being formed.
Here is the technical breakdown:
1. The Macro View (Monthly): We’ve hit a significant Double Top at the 10,600 mark. This is major structural resistance that has historically capped upside potential.
2. The Cycle View (Weekly): The Elliott Wave 5-wave impulsive count looks complete. Having topped out near 10,990, the cycle is now shifting from "expansion" to "correction." We are eyeing a move toward the 7,100 support zone.
3. The Execution View (Daily): A sharp "M" pattern has emerged. With a clear rejection at 10,571, the path of least resistance is now shifting downward.
4. The Double Top : Monthly & Daily Charts are aligned with a classic DOUBLE TOP Pattern, a classic Bearish reversal set up.
Key Levels to Watch:
Resistance: 10,570 - 10,650
Targets: Initial support at 9260, followed by a deeper correction toward 7,100.
Trading isn't about predicting the future; it's about following the structure. Right now, the structure says the bears are taking the wheel.
What’s your take on the energy sector for the second half of 2026? Let’s discuss in the comments.
The securities and commodities quoted are for illustrative purposes only and do not constitute recommendations. Investments in securities and commodities are subject to market risks. Please review all related documents carefully before investing.
Vikash Bagaria
SEBI Registered Research Analyst – INH300008155
BSE Enlistment No – 5426
Please refer to the disclaimer on the website:
https://t.co/oynCuD1KM9
#CrudeOil #TechnicalAnalysis #TradingStrategy #ElliottWave #Commodities #MarketUpdate #Investing
Hidden Setup Every Crudeoil Trader Misses!
Crude Oil Traders
Yeh koi normal setup nahi hai…
Change of Character + Demand Supply Breakout
Agar aap Crude Oil trade karte ho,
toh yeh setup ignore mat karo 👇
✔ Change of Character (Trend Shift Signal)
✔ Demand Zone Break = Weak Buyers
✔ Supply Break = Smart Money Entry
Yeh combination retail ko trap karta hai
aur smart money ko Edge deta hai 💯
⚠️ Jo isko samajh gaya, woh market ko alag nazar se dekhega
📩 Want to learn this setup in depth? DM me “CRUDE” now
The securities & commodities quoted are for illustration only and are not recommendatory.
This content is purely for educational purposes and should not be considered as investment advice or recommendation.
Investments in the securities market are subject to market risks. Read all the related documents carefully before investing.
Registration granted by SEBI and certification from NISM in no way guarantee performance of the intermediary or provide any assurance of returns to investors.
Please refer to disclaimer on website: https://t.co/oynCuD1KM9
Vikash Bagaria
SEBI Registered Research Analyst – INH300008155
BSE Enlistment No – 5426
Based on the technical structure of the West Coast Paper Mills (WSTCSTPAPR) chart:
Trendline Breakout: The stock has successfully broken out of a descending trendline on the weekly timeframe, indicating a transition from a corrective phase to a potential bullish reversal.
Support & Pivots: Prices have established strong structural support near the 390 level and are currently trading above the Central Pivot (P) at 460.15, maintaining a positive bias.
Indicator Confirmation: The RSI is emerging from a bullish divergence/oversold zone (highlighted), while the MACD is exhibiting a bullish crossover below the zero line, signifying an increase in positive momentum.
Targets & Resistance: Immediate overhead resistance is observed at 535 (R1) and 559. A successful sustained move above these levels would facilitate a medium-term advance toward 640–658 (R2).
Risk Management: A decisive weekly close below the trendline or the 460 pivot would invalidate this immediate bullish setup.
The securities and commodities quoted are for illustrative purposes only and do not constitute recommendations. Investments in securities and commodities are subject to market risks. Please review all related documents carefully before investing.
Vikash Bagaria
SEBI Registered Research Analyst – INH300008155
BSE Enlistment No – 5426
Please refer to the disclaimer on the website:
https://t.co/oynCuD1KM9
HCL Tech: Earnings Miss + Guidance Cut = Stock Tanking 10%
It has been a tough day for HCL Technologies investors. The stock price fell by nearly 10% today, trading around 1285
If you are wondering why the stock is falling and what the charts say, here is a simple breakdown:
The Bad News (Why it fell)
Low Growth: The company’s latest quarterly results were lower than what experts expected.
Weak Future Outlook: Management warned that growth might be slow (only 1% to 4%) for the next year because big clients in the US are spending less on IT.
The Good News: Despite the drop, HCL Tech will pay a dividend of 24 per share to its shareholders.
The Technical View (What the chart shows)
Looking at the stock chart, here are the key levels to watch:
The Safety Net (Support): The stock is sitting right at a major support level of 1,260. If it stays above this, it might stabilize. If it breaks below this, it could fall further toward 936.
The Ceiling (Resistance): For the stock to go back up, it needs to cross the 1400- 1,460 mark. Right now, there is a lot of "selling pressure" at that level.
Current Trend: The price has moved below its long-term average line. This usually means the stock has entered a "bearish" (downward) phase for the short term.
My Final Thought
HCL Tech is a strong company, but the next few months look a bit bumpy for the IT sector. It might be better to "wait and see", We are seeing a weekly breakdown of 200 EMA with an Engulfing bear Candle which sounds but previous two demand zones are strongly present here.
Will it make TRIPLE Bottom Here, or are we heading for 1000 levels.
My technical set up indicates more trouble ahead for HCL Tech
What do you think? Is this a good time to buy the dip, or will it fall more? Let me know in the comments! 👇
Analyst Certification: I, Vikash Bagaria, am a SEBI Registered Research Analyst (Reg. No. INH300008155/ BSE Enlistment No- 5426). The views expressed in this post accurately reflect my personal opinion about the subject securities and issuers.
Investment in the securities market is subject to market risks. Read all the related documents carefully before investing.
For Research Disclaimer Visit: https://t.co/i8ouXBTSf3
#HCLTech #StockMarket #Investing #NiftyIT #ShareMarket #SimpleFinance #Trading
The "ATM of the World" is Closing
Is Japan about to pull the plug on global liquidity?
While the world is busy watching the Fed and inflation prints, a much bigger "black swan" is quietly building in the background.
It’s not a geopolitical conflict. It’s not a bank failure.
It’s the Great Repatriation.
For years, global markets have relied on Japan as the "ATM of the world." But the ATM is running out of cash.
Here is why this matters for your portfolio right now:
The Mechanism: Japan is the world’s largest net creditor. For decades, they borrowed cheap Yen to buy US Treasuries, global equities, and commodities.
Now, with the Yen weakening and domestic yields rising, the "Yield Spread" is closing.
Converting USD → Yen and bringing capital home is becoming a strategic necessity.
⚠️ The Global Shockwave:
If Japan starts selling US assets at scale:
1. Liquidity gets pulled out: The "Yen Carry Trade" reverses.
2.Risk assets face pressure: When the "funding currency" gets expensive, speculators sell their winners (Nvidia, Nifty, Gold) to cover their loans.
3.Volatility spikes: This isn't a slow correction; it's a fast, liquidity-driven vacuum.
Impact on India (Nifty & Midcaps):
FII Intensity: Foreign funds may accelerate selling to move capital to safer or "home" havens.
High-Beta Hit: Midcaps and Financials—the darlings of liquidity—often face the sharpest corrections.
Rupee Volatility: Expect a two-phase move—initial weakness due to outflows, followed by potential stabilization if the global USD weakens.
What "Smart Money" is Watching:
USD/JPY Levels: 160-170 is the "danger zone" for intervention.
FII Flows: Sudden, unexplained exits from Emerging Markets.
The Bottom Line: Markets don’t crash because of what everyone sees. They crash when the money quietly disappears.
Is your portfolio prepared for a liquidity dry-up?
Let’s discuss in the comments—are you hedging for a global risk-off, or is this just more macro noise? 👇
#MacroEconomy #StockMarketIndia #Investing #LiquidityRisk #Nifty50 #Japan #TradingStrategy
Disclaimer: Investments in securities & commodities are subject to market risks. Please refer to the full disclaimer at https://t.co/Yn2ghlczmO
Crude Oil Strategy LIVE on CNBC TV Awaaz | Ab kya kare Traders? 17 April 2026
In this CNBC-TV Awaaz edition, we decode the strategy for #crudeoil#copperprice
Smart Money kya kar raha hai? Full breakdown!
Vikash Bagaria
SEBI Registered Research Analyst – INH300008155
BSE Enlistment No – 5426
The securities and commodities discussed are for illustration purposes only and should not be considered as investment recommendations.
Investments in securities & commodities are subject to market risks.
Read all related documents carefully before investing.
Please refer to full disclaimer:
https://t.co/oynCuD1KM9
For daily stock market updates join our Telegram Channel:
https://t.co/KqExc2mYGR