Varos AI delivers the work of business analysts 10x faster, better & cheaper with AI agents built for discovery.
Raised $10m from @ycombinator and others
My Creative Audit Process:
1. Performance download
2. Compare those metrics to other brands in their industry using @Varos_com
3. Extract creative learnings to date
4. Find creative opportunities
Want to see this in action? See this week's video: https://t.co/Q5TO7T3klv
Big product update for @Varos_com - 200+ new verticals added (through our new AI tagging system) + new UX
How we got here and why it's important:
In our data co-op, 4,000+ companies and counting are pooling their data together. They can filter benchmarks by company parameters, such as AOV, company size, vertical and sub-vertical.
Until now, we manually categorized all companies in the co-op, and therefore all of the benchmark data, into a list of 100 verticals and sub-verticals.
But before we could blink, we got to thousands of companies, which gave us the ability to create super niche verticals like Telehealth, Patriotic Clothing, Ready-To-Eat Meals, Loungewear, Money Transfer Services, and HR Software - but to do that manually was getting to be nearly impossible.
At the same time, the capabilities in AI evolved rapidly, which created the perfect storm for us to build an advanced AI tagging system that scans a website and pulls out the relevant vertical(s) based on products sold, text on the website, and other signals.
Now the level of granularity to compare yourself against, and the nuances we go into to make it apples-to-apples, is even more un-paralleled.
7. Varos
Varos anonymizes, aggregates and tags data from thousands of companies. Make weekly purchasing decisions based on CPC, CPM, and other benchmarks.
Link:- https://t.co/0xN84Bv8tH
finally got our affiliate program set up, anyone that refers someone to Varos with their link gets 30% of the referred revenue in perpetuity.
dm/email @dagoberto28 (doug at varos . com) if you want to get set up and make lots of monies!
Media Mix in the @Varos_com dashboard is one of my favorite features.
It shows you vs. your peers' spend distribution across channels to help decide where to invest your ad spend.
We just did a case study with @intensifyagency. CEO @alexgolick said “Trying out new channels is always sensitive. Each one takes time, money, expertise, and iterations. You usually need to try a few channels before finding one that works... To evaluate new channels in a data-driven way, we immediately went to Media Mix from Varos”
For one of their clients, Media Mix helped guide them to YouTube, where they achieved 30% better results than in other placements, and they now allocate ~5% of their budget on YouTube!
Full case study here: https://t.co/16uWRqGsax
actually interestingly, i'm seeing in @Varos_com for the past 3 months:
- revenue is growing a bit YoY (+3%)
- LTV/CAC is down significantly YoY (-17%)
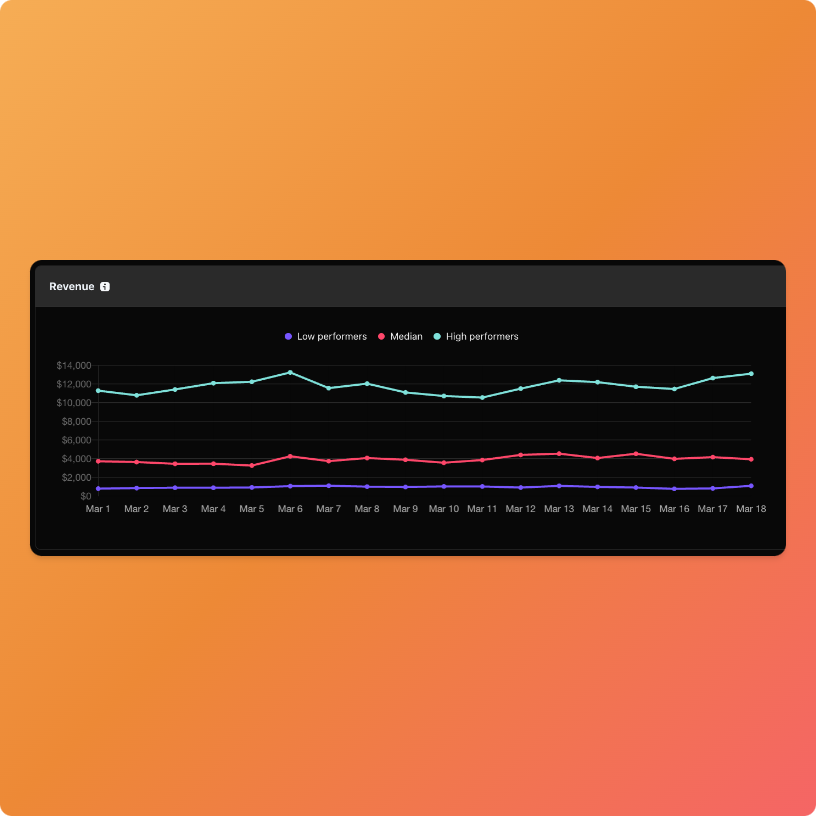
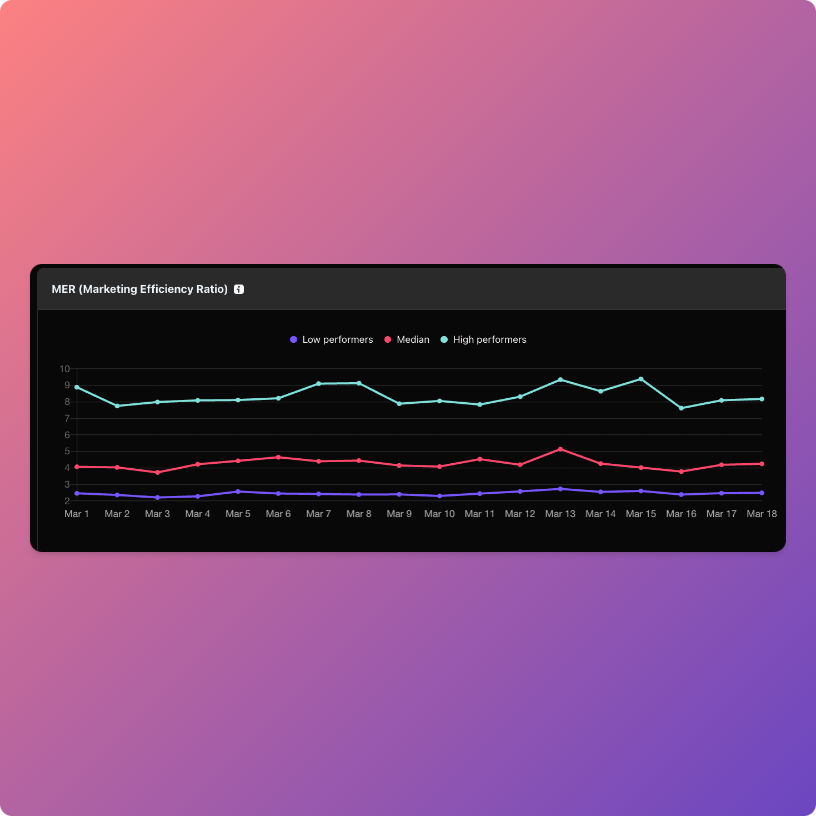
@Varos_com Btw, @Varos_com now has higher-level business metrics like blended CAC, MER, and Spend / Rev, which makes Varos even more useful.
Not only can you get ad benchmarks, but business benchmarks too.
So we can see things were also pretty normal for Shopify stores:
Today, with the launch of our Executive Summary feature, we @Varos_com take our step into also being the place where a CEO can understand how their overall business is doing compared to competitors AND if they had a good or bad week.
Businesses expect ad performance to improve every month.
Yet performance is genuinely affected pretty hardcore by market movements & economic factors out of your control.
https://t.co/qdVYdK26ml
➡️ Need benchmarks for market research - use Varos
➡️ Shows a benchmark of where your business stands against the competition
➡️ Help your clients gauge their business performance based on their data
Two weeks before we welcomed 2023, the median spending on Facebook ads for medicine in the US was $7,763, one week before, the spending almost doubled going to $13,197!
Insights via @Varos_com data
Do you ever get curious how your competitors split up their paid media budget by platform?
I certainly have always been curious; but now it's easy to see with Media Mix Reporting from @Varos_com
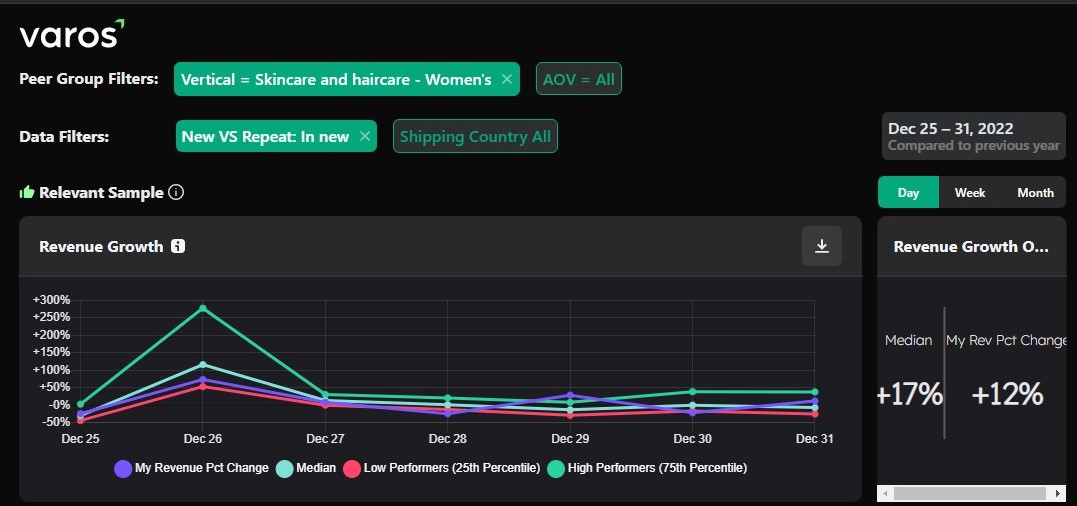
In the week before the new year, the revenue growth from new customers in skincare and haircare for women was up 17% compared to the previous year and the revenue growth from new customers in skincare and haircare for men was down 66%.
Insights via @Varos_com data
6. Varos
What: Evaluate your industry paid performance vs the market & benchmarks
Use case:
• Make weekly buying decisions on benchmarks on CPC, CPMs, and more
• Prove to clients that recent decline or increase in performance based on their data
Link: https://t.co/NTuBXQtIxD
Man for a lot of brands I've seen or audited, December into January (Q5 as some call it) had some of the best performance I've seen in a while. I think this is a combination of some recent meta advancements, seasonal demand, alongside some really cheap media. Let's take a look: