Came across this document of Qullamagi’s 2020–2021 trade positions.
If you go through these trades, one of the best things you’ll notice is the risk–reward. There a lot of losing trades. But the losses are not big, mostly around one or two X.
On the other hand, the winning trades are much bigger.
If you go through the stock names, try to understand the thought process behind each trade.
Yes, this is from 2021, but a lot of things can still be understood today if you go through these trades.
Go through it. Try to understand it. Good luck.
Link - https://t.co/7Yl0qzb1AW
#Strategy#Trading
Intraday trading strategy for index and stocks.
Strategy :
15 min Opening Range Breakout (ORB):
1) Define the high and low of the 9:15–9:30 candle.
2) Enter long if price closes above the ORB high on a 5-min candle with volume > 1.5× the 20-period average, and price is above VWAP. Mirror for shorts.
3) Initial stop goes at the opposite end of the ORB or 1× ATR(14, 5-min), whichever is tighter.
4) Target 1.5R partial, trail the remainder at VWAP or a 2-bar low/high. Hard time-stop at 14:30.
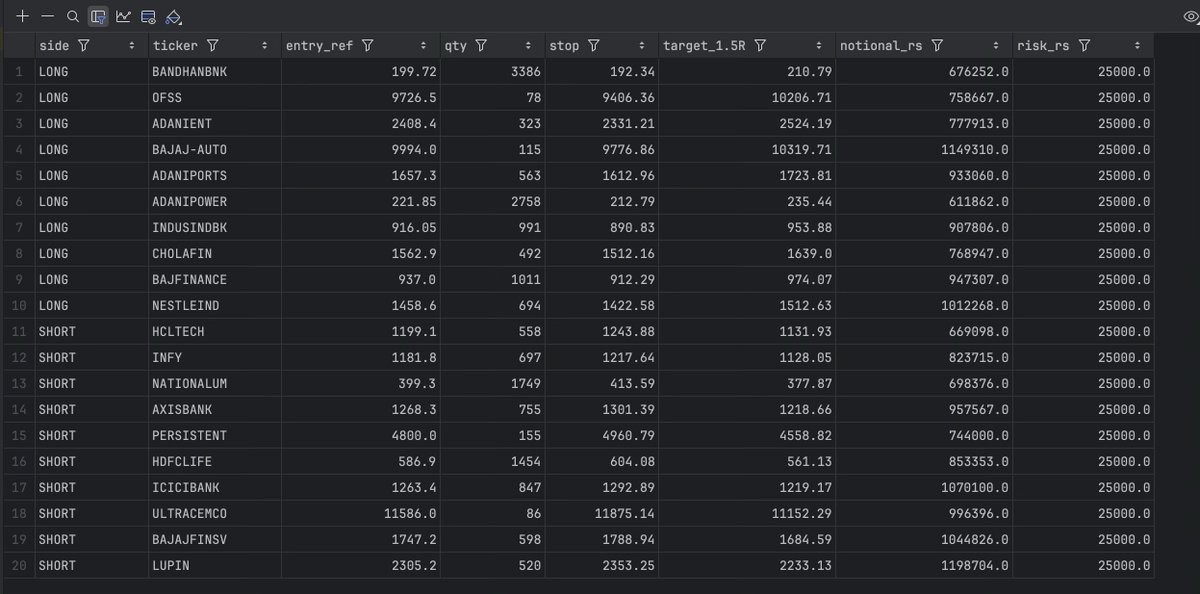
Risk Management (assuming capital is Rs 25 lacs)
1) Per-trade risk capped at 1% of capital ie Rs 25,000. Position size = Rs 25,000 / (entry − stop). With a typical 1% ATR stop on a Rs 1,000 stock, that's around 2,500 shares, well within MIS leverage limits.
2) Max 3 concurrent positions to avoid correlation blowups as sectors are highly correlated intraday, for eg, a banking selloff drags the whole financial pack.
3) Daily loss limit at 3% (Rs 75,000) hit it and stop trading for the day, no exceptions.
4) Weekly loss limit at 6%. If you breach the weekly, you take the next week off and review every trade.
5) Position sizing in options needs an extra layer because of gamma. Size options positions by premium at risk; never put more than 0.75% of capital into option premium on a single trade, and use ITM options where the delta gives you stock like behavior with capped downside.
Eg.: Your capital for options is 0.75% X 25 lacs = 18,750 Rs. Say NIFTY is at 26,000 and ORB+VWAP setup fires a long signal.
NIFTY 25,800 CE (200 points ITM, delta ~0.65)
Premium quoted: Rs 280 per unit
NIFTY lot size: 75 , Cost per lot = 280 × 75 = Rs 21,000
Now check against your budget: Rs 21,000 > Rs 18,750. You cannot buy 1 lot. 3 alternatives would be:
a) Skip the trade. The position is too big for your budget.
b) Don't go for lower delta strike; the option movement will be more influenced by theta. Pick a different expiry or Use a futures contract instead, where your risk is defined by stop distance not premium.
Instrument:
For index trading, prefer NIFTY weekly options 1–2 strikes ITM (delta 0.6) to control gamma risk.
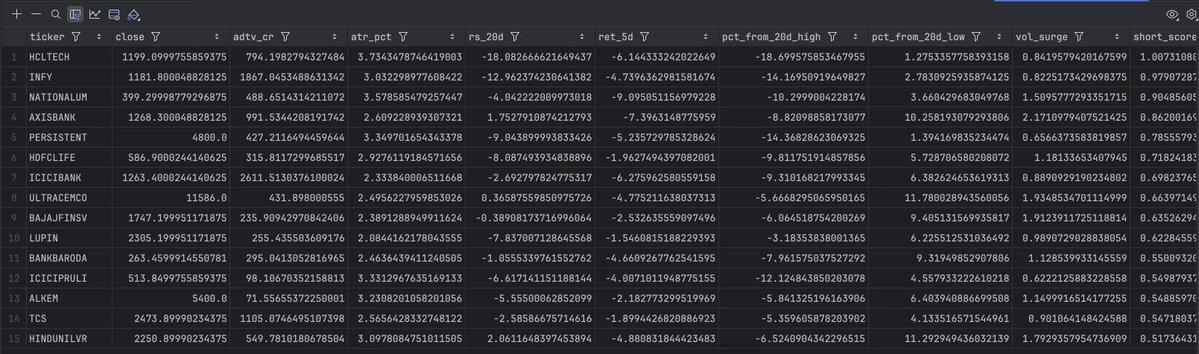
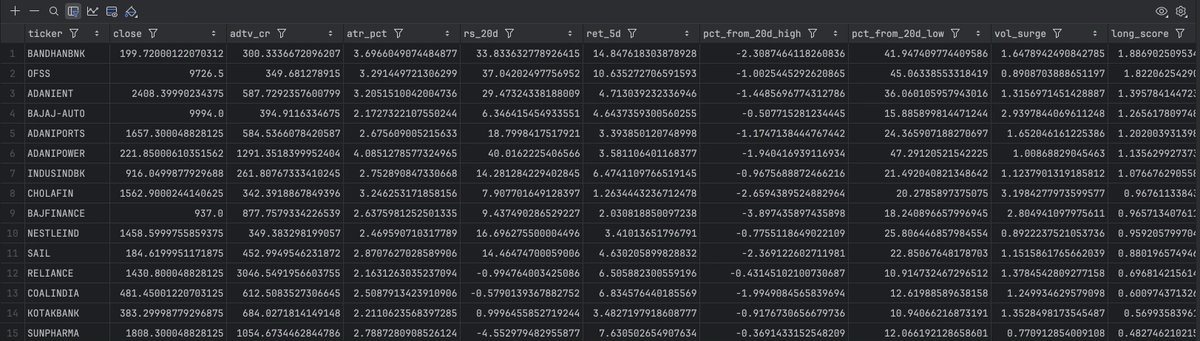
For stock screening for ORB trading, previous day scan for:
After 4 PM run a screener over the F&O universe
a) average daily turnover above Rs 100 crore (liquidity floor) AND
b) ATR% between 1.5% and 4% (you want movement, not chaos) AND
c) 5-day relative strength versus NIFTY, distance from 20-day high or low (proximity to a breakout level), and a recent volume surge factor (today's volume vs 20-day average).
For Monday long and short trades stock screener attached along with reasons and trade plan attached in picture.
Those who trade this , please don't directly pick stocks randomly from the picture. The stocks become eligible to trade only if it satisfies intraday ORB conditions mentioned in beginning of the tweet. Qty mentioned in pic is assuming rs 25 lac capital. Scale down if capital is less.
Pre-Market Routine (8:30–9:15 AM)
GIFT NIFTY tells you the gap. Quickly scan Asian markets, crude (energy/auto sensitivity), USDINR (IT/pharma exposure), and the 10Y G-Sec yield. Read overnight headlines for your watchlist names. By 9:10, write down on paper your top 3 long candidates and top 3 short candidates with entry triggers and stop levels. Drop stocks that have Corporate events like results, dividends, etc. due during the day.
The EPS line is one of the cleanest ways to identify fundamentally strong stocks early.
You can access this TradingView indicator for free here:👇
https://t.co/RwLVPjmYBe
If you still ignore earnings after this, the market will happily charge you tuition fees.
📌I have a collection of 5 star setups that I review regularly. ⭐️⭐️
1⃣ I always train my "pattern brain". That's important. These patterns need to be burned into my mind.
2⃣Reminding me about my edge. I increase my conviction into my trading and build up confidence.
3⃣These patterns repeat over and over again. It's worth to wait for them to make big money. They are rare but they will appear in the right market.
✅Today I have my own model books but I still practice and train my mind.
✅That's very important to keep me motivated and train my pattern brain.
🔴Kind Attention :-
If you are one of those guys who has missed this rally & is in FOMO right now.
Than this tweet is for you Guys
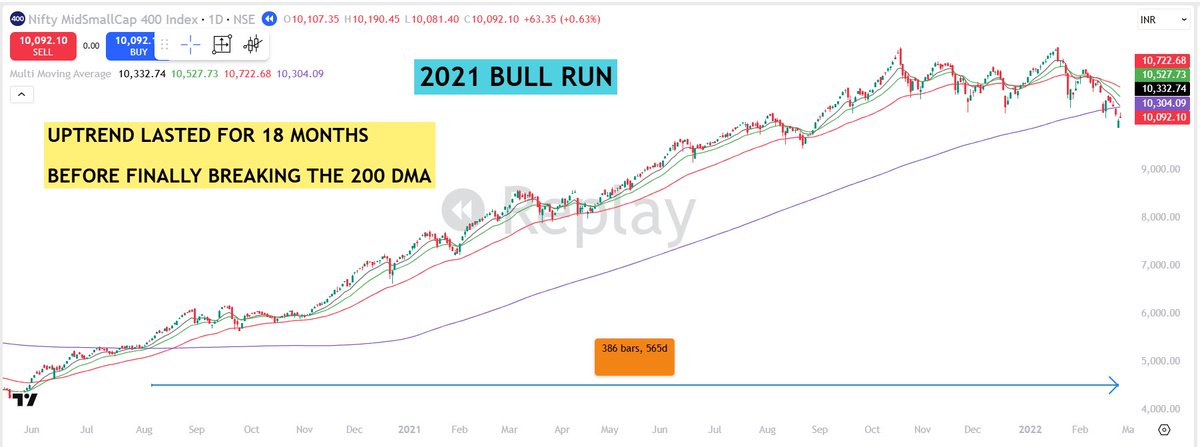
Bull Runs lasts for a very long duration Like The bull run in these years lasted for :-
✅2017 - 13 Months
✅2021 - 18 Months
✅2023 - 20 Months
So don't panic if it a genuine uptrend you will get ample opportunities in future to trade & make lot of money
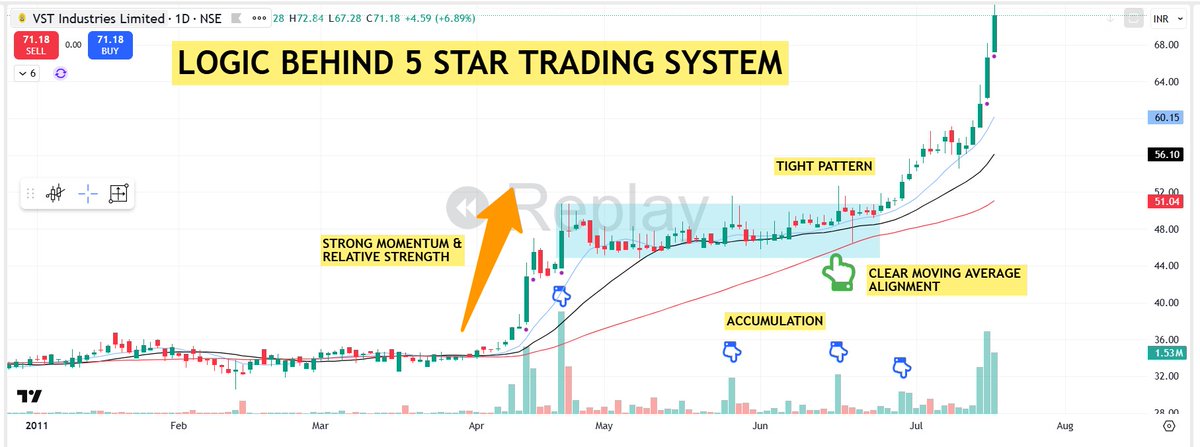
💥💥The Logic Behind 5 Star Setup System
My trading system revolves around structure. The 5 star setup is not about perfection - it's about probabilities👇
🟢Star 1 - Trend Alignment :
Price must be above MA 20 & MA 50 , with all Moving Average Rising
🟢Star 2 - Fundamentals/Story :
Quarterly EPS growth + 50% and/or sales growth + 20% OR an inspiring strong story! Institution buy growth, not hope.
🟢Star 3 - Technical Structure :
Flat bases, Tight bases or VCP'S -- Volatility must contract before expansion.
🟢Star 4 - Relative Strength :
Stock should show RS behavior. Leaders lead early
🟢Star 5 - Volume Confirmation :
Multiple 2x average volume spikes and strong volume on up days.
🟢Star 6 - Risk Filter :
No setups during choppy markets - Avoid trading against market direction.
🟢Star 7 - Liquidity Rules :
Pick liquid stocks.
🟢Star 8 - Conviction Check ;
If it doesn't feel obvious and structured - Skip it.
🟢Star 9 - Post Trade Review :
Grade every trade on all 5 stars. Data drives consistency.
The most dangerous discovery in neuroscience is that your brain actively categorizes "Future You" as a stranger.
In 2011, Hal Hershfield discovered something that destroys every assumption about willpower and self-control.
When Stanford researchers put people in brain scanners and asked them to think about themselves in 10 years, the neural activity looked identical to thinking about celebrities or random strangers. Zero overlap with the patterns that fire when you think about your current self.
You literally perceive Future You as a different person.
That disconnect explains why 92% of New Year's resolutions fail within 60 days. You make promises to someone your brain doesn't recognize as you. Future You will exercise. Future You will save money. Future You will quit smoking. But to your current neural circuitry, Future You is as foreign as the person sitting three tables away at a coffee shop.
The question is would you trust a stranger to follow through on your commitments?
The shift happened when Hershfield tested "future self-continuity" interventions. Simple techniques that force your brain to recognize Future You as actually you. People who spent 10 minutes writing detailed letters to themselves 10 years from now showed 60% higher follow-through rates on behavioral commitments compared to control groups who just made standard resolutions.
The mechanism is startling in its simplicity.
Writing to Future You activates the same brain regions that fire during autobiographical memory recall. You start processing Future You with the same neural machinery you use for Current You. The psychological distance collapses. Future You stops being a stranger and becomes a continuation of your identity timeline.
This rewrites the entire framework of behavior change. Willpower is less about forcing yourself to do hard things and more about convincing your brain that the person who will benefit from those hard things is actually you.
But, 99% people approach goals backwards.
They focus on the action. Do this. Stop that. Change this habit. But the action is downstream from identity recognition. If your brain categorizes Future You as someone else, every sacrifice you make for Future You feels like charity work. And humans hate doing unpaid charity work for strangers, especially strangers who never seem to appreciate it.
The people who sustain major life changes intuitively understood this connection before Hershfield proved it scientifically. They do more than just setting goals. They built detailed mental models of their future identity. They could describe not just what Future They would do, but how Future They would think, what Future They would value, how Future They would spend Tuesday afternoons.
The 60% improvement must not be considered a ceiling. It's the baseline for people who accidentally stumbled into future self-continuity.
When researchers deliberately trained people to maximize the neural overlap between current and future self-perception, follow-through rates approached 85%.
That number breaks most of what the self-help industry teaches about habits and discipline.
So, the takeaway is you don't need more motivation. You need better self-recognition software. Your brain needs to see Future You as clearly as it sees Current You. Every major behavioral change becomes effortless once that perceptual shift locks in.
Future You isn't someone you owe. Future You is someone you are.
Once your brain accepts that equation, behavior change stops feeling like work and starts feeling like basic self-preservation.
💥💥Don' t Miss it - This Tweet can change your trading
🟩Biggest reason only few people become successful traders -
Not because they’re smarter , but because they’re willing to do the boring, consistent work nobody else wants to do.
🟥Most traders fail because they avoid the one thing that actually creates skill: "REAL WORK/SCREEN TIME
1⃣You need chart books.
Hundreds, then thousands of charts. Patterns have to burn into your memory so you recognize structure instantly without guessing.
2⃣You must back test your system. Not for others — for yourself.
You need the conviction that your approach works, otherwise you won’t survive the next drawdown.
3⃣Only you can do this work.
No coach, no mentor, no guru can do the repetitions for you. They can show you the way, but you must take every step yourself
4⃣You need time - often years.
That’s normal. It takes time until your brain adapts, until you truly understand what you’re doing, and until trading feels controlled.
Some of the chart screenshot from my chart data bank
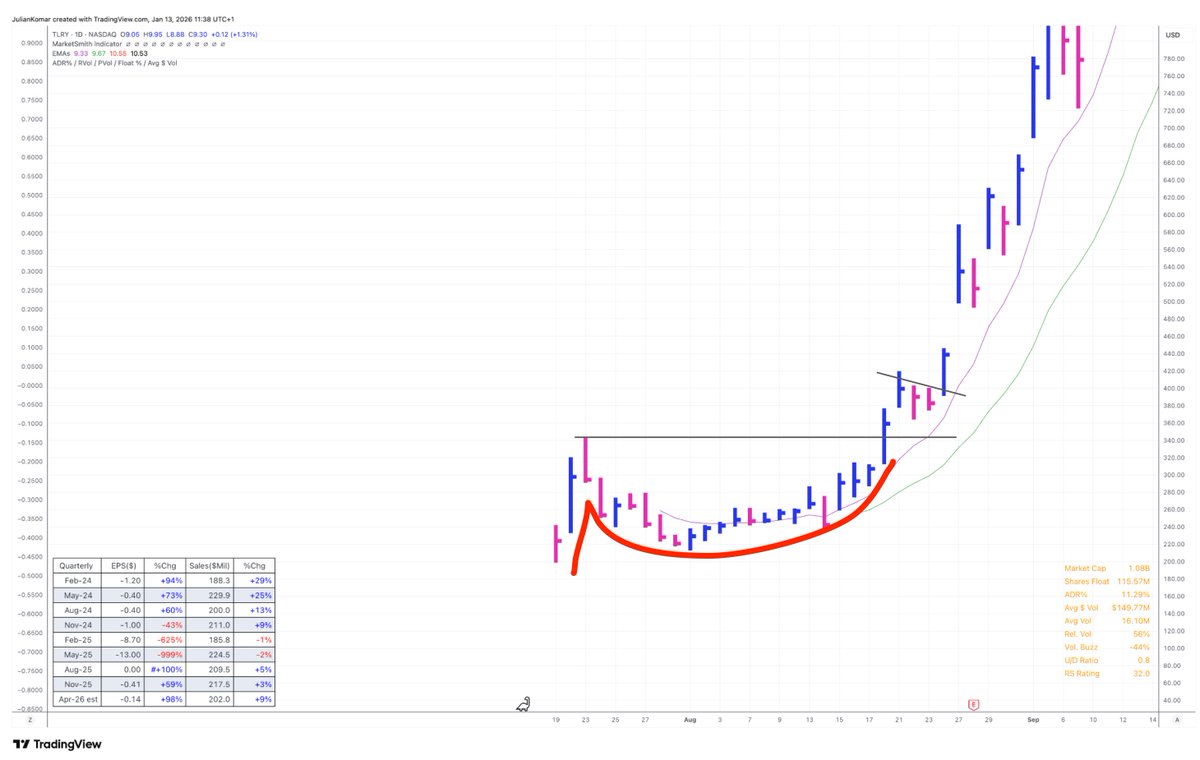
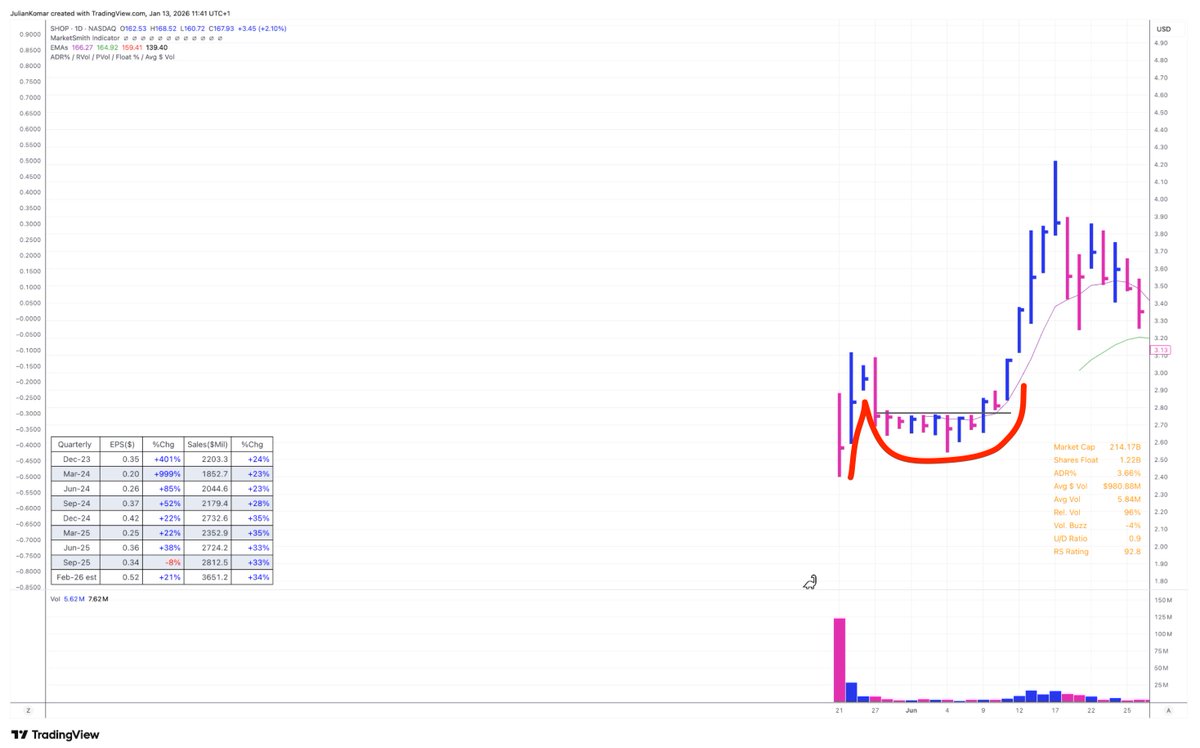
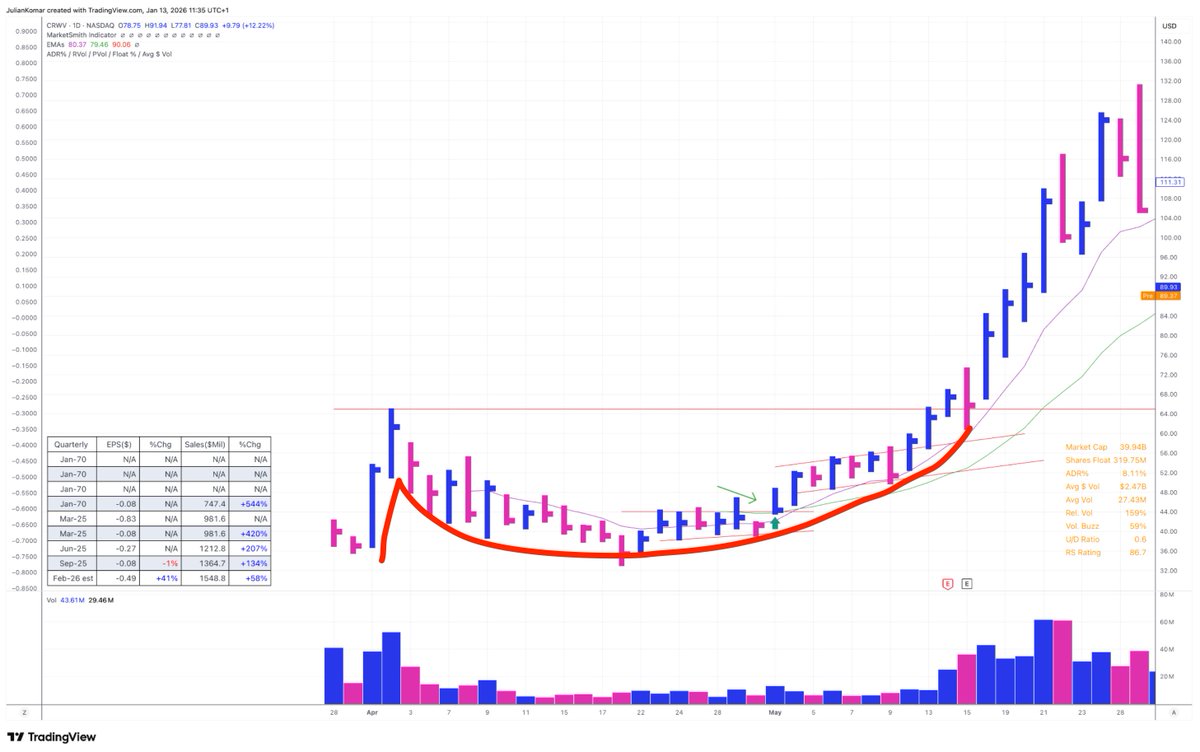
IPO U-turns #trading patterns are rare—but when they show up, they can change your entire year 🚀📈
I track this chart pattern very closely.
Here’s how it works 👇
1) Hot IPO Launch: Strong story, strong demand. The stock goes public and often rallies immediately. That’s your first signal—institutions are interested.
2) Sharp Pullback: After the initial hype, it corrects for weeks. Weak hands get shaken out. Most traders lose interest here.
3) Rounded Bottom: Price stabilizes and slowly turns. No panic selling anymore. This is where accumulation often starts.
4) Right Side Strength: The stock begins to climb again. Higher lows, improving structure. Demand comes back quietly.
5) Tricky Entries: You often don’t get a perfect, tight base. That’s the challenge. These stocks can just move—without giving you the “ideal” entry.
6) Explosive Potential: If it works, it moves fast. These are not 10–20% trades. These can become real leaders.
But here’s the reality:
They don’t appear often
They require patience
They require strong stock selection
No story, no growth, no trade.
I focus on:
- Clear theme or narrative
- Strong EPS / sales growth
- Real institutional interest
These patterns repeat.
I’ve taught this to thousands of traders.
You can learn this too.
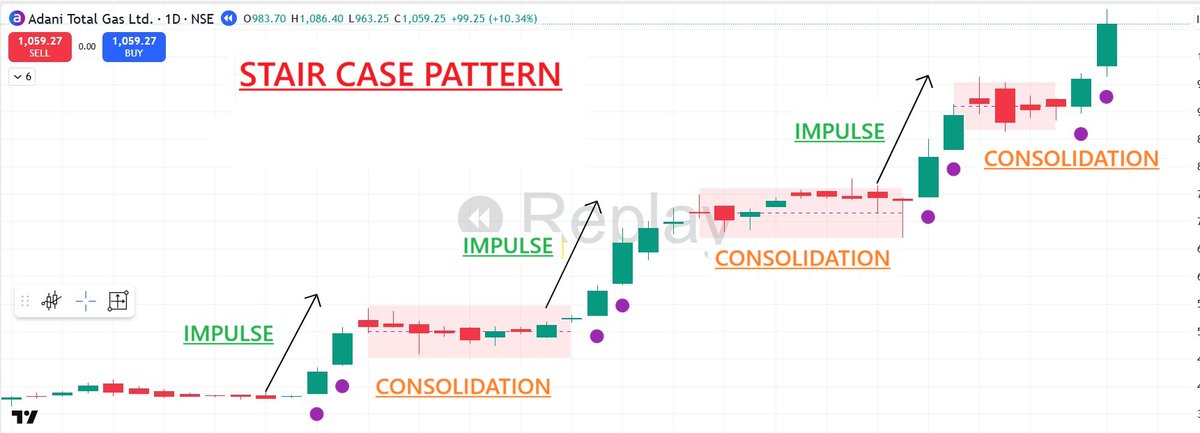
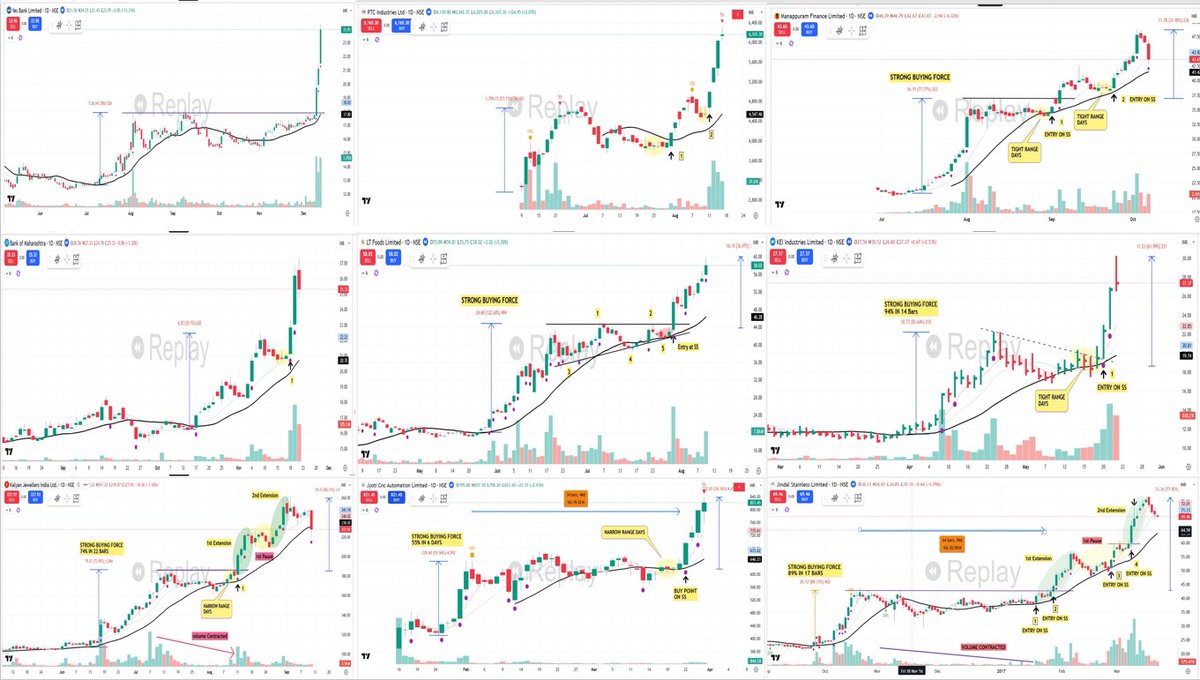
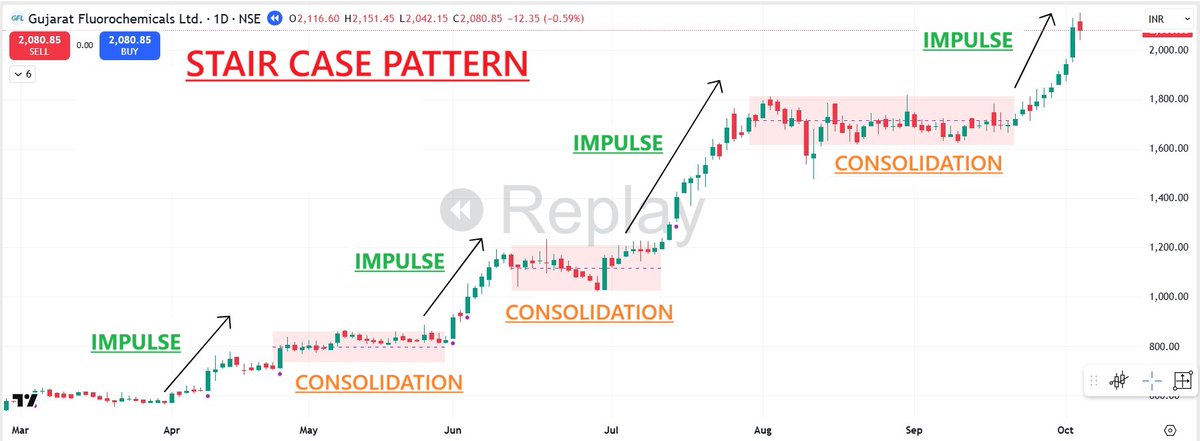
"How do STRONG STOCK Move"🚀🚀🚀
💡They move in a "STAIR CASE PATTERN"
🟢Staircase Logic
Stock rarely move vertically for long. Every big advance is followed by consolidation - a healthy pause before the next leg higher
🟢Impulse Move :
The first strong leg usually comes from a catalyst- Earnings ,guidance. Volume expands sharply, price accelerates.
🟢Consolidation phase:
After the run price contracts. Volatility drops, range tightens, volume fades. Institution use this time to absorb supply while weak hands exit
🟢Structure Formation:
Each consolidations build a new base - flags, flat bases or VCPs. These pause act as launch pads for the next advance
🟢Buy Zones
The optimal buy point usually appears near the end of a consolidation - when price tightness near highs, volume dries up & MA (10 or 20) catch up.
🟢Avoid chasing the stair
Buying mid - step (after a parabolic surge) leads to poor timing.
🟢Trend Continuity
As long as each base forms above the prior one & MAs remain stacked upward, the staircase in intact. That's what defines a true uptrend.
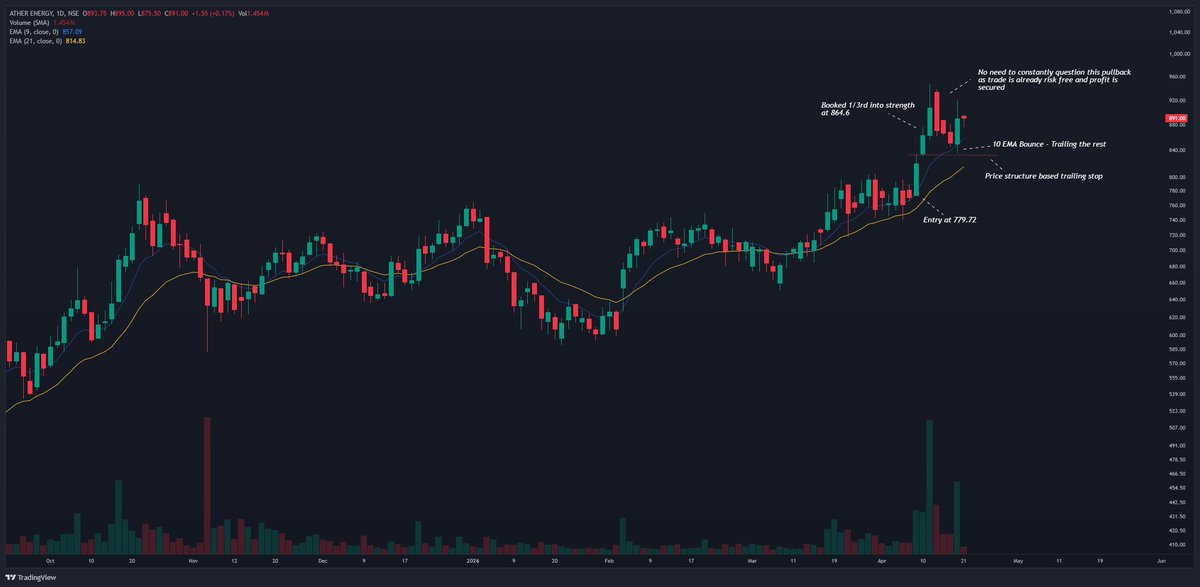
How to use Moving Averages as trailing stops
As traders, finding the right entry to manage risk is important but managing exits without emotions is equally critical. Adding discretion to exits often leads to emotional decisions, which can hurt performance over the long term.
You can’t outsmart moving averages - There’s a reason why many successful traders say this - they help keep the process simple and objective.
Your exit approach should be straightforward, provided you do one thing right:
Enter at a low risk point that offers asymmetric reward, and then let a combination of EMAs and price structure guide the exit.
Once in a position, if it turns into a strong mover:
- Book 1/3rd into strength
- Trail the next 1/3rd using the 10 EMA (closing basis)
- Trail the final portion using a combination of price structure (swing lows) and the 20 EMA (closing basis)
That’s it.
The idea is simple, you don’t need to constantly question whether the stock is still good or if the pullback is healthy. If the entry is right and risk is defined, you let price and moving averages dictate the outcome.
Some annotated charts examples from my recent trades attached
- ATHERENERG
- GMDC
- NETWEB
- AVANTIFEED
After scanning, say only 3-4 stocks are left, ADR can help in the final selection.
If all other things look similar, prefer the stock with higher ADR.
Example:
If a stock has 10day ADR of 5% but recent candles are only 0.8%, that is a big contraction & very tight in a stock which moves 5% normally
This kind of setup has a high probability strong move immediately
But all other parameters like Prior uptrend etc etc as I mention all the time should also be there
https://t.co/8FqW6LVFBm
Meet Dan Zanger - the trader who turned
$10K → $42M in <24 months. A 29,333% return.
Verified by Fortune magazine. Still a world record. 🚀
His edge wasn't luck. It was a repeatable system:
→Chart patterns + volume confirmation
→ Momentum entries
→ Stops approx. 3–5% below technical buy point
→ Leading stocks + leading sectors CANSLIM influence
→ Never chase. Entry within 5% of the breakout
→ Breakouts on heavy volume = his sweet spot
The real lesson? He didn't just read charts. He studied the intersection of Earnings + Chart Pattern + Relative Strength + Volume Contraction + Market Conditions. The more that aligned, the bigger he sized.
These 4 Videos will tell you more about him and style
https://t.co/SYmwU6BDgn
https://t.co/bo1h0AyPnZ
https://t.co/mIpVsnfmc2
https://t.co/oa7S6cxtDu
Then go to his website, pull up every past winner, plot them on a chart and find the pattern yourself.
https://t.co/ICHo1iT2hw
That exercise alone will teach you more than 100 trading books.
29,333%. No tips. No luck. Just a repeatable process executed with obsession. 🔁
I connected Claude AI to TradingView.
One connection handles auto watchlist scanning, ranking potential trades, indicator creation & strategy creation inside TradingView .
No manual work. No Pine Script skills needed.