Ethereum (fomo edition)
“ETH looks like it’s going higher… but I own zero. What now?”
1. The situation
2. What I would do
70+ days, 140 cryptoamsterdam posts later, and it's ripping.
ETH reclaimed the range low as the most hated asset.
From getting ridiculed at the initial posts about this reclaim to being asked if this is a good entry.
Probably the core reasons that most people do badly in crypto, even in a bull run: your human emotions.
/ You feel uninterested when an asset is at the lows in the support, after weeks of downward movement.
/ You don't trust the reclaim of the range lows, the pain is still fresh, and you expect this rally to fail just like the others
/ Ethereum is now consolidating above the range lows, I'm gonna wait for a dip.
/ Oh, there we go, it's dipping; shit, this looks bad, I'm not gonna buy this.
/ Oh, we are ripping higher again, 2500....2800....3000....3200....3400...up 60% since the dip, this is not stopping, I need in!!!!!
Most will look at this and think, “Okay, this looks ridiculous,” then go make the same mistake again. (buying green and not red)
You’re in a tough spot.
A straight move into range highs without pullbacks is normal here, but deep pullbacks after a rally like this are also normal. Day-to-day price action moves in the parabolic stages are hard to predict.
/ What would I do?
If I had zero Ethereum exposure here, but wanted to get in, I would do the following.
First of all, if you didn’t buy at the range low (where it was 70 days) after the reclaim but want to allocate here and right now, you’re trading based on emotions. Buying after things went up hard, selling when they went down hard, and not being interested when flat at the bottom.
You need to acknowledge this.
Even though I do think we’re going (much) higher, fully topblasting and going all in here is also a very bad idea imo.
Why?
Because again, you’d be doing this mainly out of emotion, following feelings into a trade.
And besides the downside risk if we pull back deeply from here (mid-range resistance zone) to the range low, for example (which is possible without invalidating the HTF setup), there’s also the fact that you’re still entering based on emotion.
These same emotions will likely lead you out again during a (maybe short-term) pullback into the lower range (if this happens), capitulating for a loss into support, where you should’ve bought.
If you have been very emotionally based on your decision making, you will put yourself in such a difficult position by top blasting here if things temporarily go south.
Again, this does not need to happen, but the probability is too high and will very likely drop you for a big loss at the bottom, while the htf setup is still valid.
1) Scaling in vs buying all at once
I would first of all not make 100% moves. Meaning, buying (and selling) all you want to buy, or selling all you have at once. It's okay to slowly scale in. If you feel extreme fomo here, I sometimes top blast a very small portion of my total planned buys to temper this. I, at the same time, expect (and hope) it to turn temporarily against me.
2) Wait for dips.
I would wait for dips. There are always dips in a bull market; sometimes they get bought up quickly, sometimes they turn into a lower time frame downtrend within a bigger uptrend. At least, you did not top blast. I would wait for 10-15% dips, slowly fill a little bit, and if we go deeper, buy a little bit more.
3) Give it some time to form a setup.
I’d look at key levels like the mid-range or the first quarter (0.25 level) to build a setup around.
For example, a mid-range deviation, price falls below mid-range in an LTF downtrend, then reclaims it and leaves it behind as a deviation. You can place an invalidation below that level. If stopped out, look for a new setup.
Another scenario would be a dip into the range low (which I would buy), but also, again, a trigger could be a deviation and reclaim of the 0.25 level.
This would be a very deep and surprising scenario for me, but possible, and it's good to at least stay open to it in case it happens. Macro setup would still be valid, and you don't want (again) to turn very bearish into the setup.
So, personally, I do think continuation is the highest probability, but have a plan to scale in and stop ignoring red and dips, and stop emotionally buying green.
Bull markets are great, except for the ones:
> Using high leverage
> Buying green, and fading red.
3/ Drawing the range high and low
&
4/ Refining your levels with confluence
Two types of ranges:
/ trend slowing down into a reversal
/ top of a trend (blow off top)
/ Trend slowing into a range
The first sign is when market structure starts to flatten. Imagine a steep downtrend with lower lows and lower highs, then the steepness fades, and selling slows down.
That’s the first clue we might be entering an accumulation range, possibly leading to a reversal. The second sign is when the market stops making new lower lows and starts printing equal highs and lows. In other words, a range.
> I'll be using the initial swing high and low as range high and range low.
/ top of a trend (blow off top)
You don't need to spot it in real time, and as we're talking higher time frame macro structure now, you will have a lot of time.
Most will be bearish at the bottom, but you will be watching a potential range low reclaim setup and structure.
In this case, I'll start with the range by using the massive swing high (blow off top) as range high and the initial swing low after the steep downtrend as range low.
Now comes the 'refining' part. First of all, you can await more price action to see if the price keeps interacting with the range low from above, but also potentially from below.
Secondly, as you can see in the chart above, you can add range levels to see if these 'make sense' and price reacts to them.
The third most important level of a range is the mid-range, and as you can see, after adding it to the chart above, it perfectly interacts as support/resistance levels to the price.
On top of the mid-range, you can also add the quarterly levels (0.25 and 0.75) to the range to double-check if the price reacts to them.
Sometimes your initial range doesn't make the most sense at first. But after looking at it, you, for example, start to see that price reacts to a level slightly lower, and maybe then you try another swing high or low wick for your range high, that fits better and makes more sense.
Play around with it and don't be too picky, as context matters most. (key levels in or around the range, swing highs/lows, etc.) + With experience, spotting will become easier.
Full Crypto Cycle Altcoin Outlook
Why your altcoins haven't pumped yet and why I keep comparing this cycle to 2017 (full analysis)
"But Astro, what about altcoins, why are they not going up yet, when will they move, I don't understand"
The most frequent question I receive, by a thousand miles far, period. Especially lately since I have been focusing on $BTC, after booking our initial gains on the first (rather small) push of classic alts, and why I have been preaching extended altcoin chop around now.
So almost every post, at least one person asks about altcoins, worried about their bags, which ones to buy and, "when do they go up?". "Has the state of the market ruined my alts?" Funny because even big influencers start to worry or shame altcoin bags just because even bodies up to the size of governments are now pump and dumping altcoins.
And my answers to all of that is always the same: that first of all news is misinterpreted, misconstrued and designed to play with your emotions.
And secondly that "this cycle is a lot more like 2017, not 2021." And exactly that explains why there is some impatience out there, people being worn out as altcoins would have moved October/Nov last year already if this cycle was anything close to 2021.
But both for $BTC, $ETH and all the altcoins (and per consequence, $BTC.D) all have been moving different than last cycle since the start. And here I'll explain with clear examples once again why, to increase your understanding some more and help your patience and conviction.
I'll be giving a breakdown of the numbers first, then apply some logic (why would today be the same as 2017) and then my conclusion.
The breakdown
So, to properly understand when and what moved in 2017, and why they are identical, we start with the leader, as $BTC has already shown a lot of its hand.
And with regards to $BTC. It's clear. $BTC's 2017 playbook was to range (i), put in a big move (ii) and pullback drastically back to the parabola (iii), doing that multiple times, each time at a higher price, where at the same time in (iii), all (especially altcoin full retraces) hopium is lost very fast, yet $BTC keeps its high price, and keeping it's parabolic advance.
Sound familiar with today?
This gradual step-stone cycle approach is defly not familiar with 2021 where it was all about catching moves as fast as you can as $BTC and alts went up-only for months, and then remained silent for forever (a full year almost) and then they pushed hard again, two waves, and done.
I drew both parabolic advances on both $BTC charts of 2017 and today. Note that it's not possible to draw this parabolic advance out so cleanly on the 2021 chart, because the rise was not as stepstone and gradual, as just explained.
Arguably, the 2023 parabolic advance is slightly less clean than the 2017 one. But by no comparison is the 2021 cycle following any type of parabolic advance.
And in terms of altcoins, the type of movement was no different either.
In 2017, alts remained almost flatlined, all the way until the Final year March-November period.
Below, I selected 4 very iconic altcoins at the time. $ADA, $DOGE, $LTC and $IOTA.
There are far more altcoins, but they surely were big drivers of the market and more than enough to explain what I mean.
And from each of their charts, it's clear to when, where and how they moved:
$DOGE: Ground Level -> 18x (March '17)
$ADA: Genesis -> 130x (Nov '17)
$LTC: Ground Level -> 800x (March '17)
$IOTA: Ground Level -> 110x (Oct '17)
So they all stayed flat until at least March '17 (the final year i.e. comparable to 2025): $ADA was listed in masses in Nov and went up with the market, and $IOTA stayed flat until at least October.
This is different to 2021, where most of the altcoins went up already in August - Feb starting in the second to last year (2020), only to crash very hard once (70% in a few weeks) in the last year (summer 2021), which is where the major difficulty of that cycle was.
In this cycle, the major difficulty is the wait a priori (right now).
So again, clear resemblances of 2017, not 2021, yet there is still disappointment to why alts have not gone up yet.
Finally, let's talk about $BTC.D and $ETH, why it has been tricky to analyze and why $ETH has been seemingly 'disappointing' too.
The case with $BTC.D is that many expected the first $BTC.D drop to be sharp and straight to 40%-30%, because that is what it did in 2021.
But again, in 2017, we had a rather slow decline (coming off of 100% at the time), into a stubborn lower high retest, and then the real drop (only late in March during the final year).
This is another reason - next to all the reasons given of the analysis of our $BTC.D charts - why I called the top on $BTC.D, but expected a lower high retest (hence why we went risk off on the 10k altcoin challenge account to protect our 6k profits, yes I still continue them). I was wrong with the lower high, instead it became a higher high. All good, I accepted it.
But the point is that this gradual descent is far different than the double top of the 2021 cycle, where the second drop happened far earlier (Jan final year).
That is because $ETH rose gradually in 2017, causing some other alts to move (risk on mentality) early on, but not all too much, and only later, it too exploded fast, just like all the other alts. Not what happened in 2021.
Logic
So, numbers are very clear and speak for themselves, now some logic. Why would we move more like 2017, not 2021?
I think firstly, because most people position or try to outsmart the market thinking that the most recent cycle will repeat exactly (short term memory fallacy). So the market outsmarts the ones trying to outsmart the market and moves more like 2017 instead. We had a similar type of experience during 2021, where it moved like 2014 and everyone was expecting a repetition of 2017 (this happened in far less obvious ways, but still..)
Secondly, both the 2017 and this cycle have been defined by mass adaption, a lot more than the 2021. Just my opinion, but the 2021 cycle IMO was just an extension of the retail adoption of 2017, with more retail coming in (not really institutions or countries yet aside from one on $BTC and maybe some institutions on $ETH). Now, with the ETF's and Trump for president, we see another cycle of extreme adoption again (just like 2017), this time, from the governmental and institutional side (Trump for president helped, but it was inevitable regardless IMO).
So both very reasonable arguments to why this cycle is like 2017.
Conclusion
Most important sections is this: the take-aways from these observations. First is the obvious, and that's to still be patient and still have healthy expectations for altcoins to go up. And by that I mean, classic, somewhat useful altcoins with a purpose.
You know, those teams that try to actually build something with a unique mechanic or entire ecosystem, in an attempt to change the world. Ever heard of those coins? Yeah, they are all around.
I know it has been a lot of PvP so far and just extract money P&D and memes, useless stuff that dies in less than half a year (2017 was no different, just on different scales), only a few utility sectors like AI or RWA have somewhat taken off so far. But there are real projects (AI and RWA included, not memes) out there and although they do not seem as useful yet, they build towards that and people love to speculate on that side of the market, even more so when altcoin season arrives.
So personally I am largely (not exclusively) invested in those.
As a final note, this is a historical analysis. I am not saying that history repeats exactly, and neither will this cycle be exactly like 2017 (just look at the $BTC.D higher high we had now and lower high we had in 2017). Also that, would be far too easy. That is why we carefully and deeply analyze the markets at all times and position accordingly. But this post should help you put you on the right track, understand the rough lines of how things are going. And at least get you off the short term memory mindset of falsely just looking at the most recent past. A good lesson to carry over for the rest of your trading/investing lifetime.
The cycle dynamics haven’t changed since forever.
But I think it'll end. (soon)
Impacting:
> 4-year cycle
> Altseason
> Supercycle (but not like most expect)
Let's dive in:
1. Why I think it'll change
2. What I'm looking for this cycle
👇
The most parabolic part of the cycle
// Time for Altcoins to shine?
1. What cycle stage?
2. Favorite Altcoin setup.
3. Altcoin sectors I'm watching.
4. Profit taking
Let's dive in because I think it's almost time! 👇
Favorite Altcoin setup:
Often, a mini-cycle forms within a bigger cycle.
You can use the mini-cycle structure as an entry trigger to jump into the higher time frame bull cycle.
1. Mark the higher time frame range.
2. Mark higher time frame cycle stages.
3. Find coins in stage 4 (pre-parabola stage 5).
4. Look for dips into/below the range low.
5. Check for a mini-cycle forming near the range low.
6. Spot mini-cycle stage 3 at/below the range low.
7. Buy the mini-cycle higher high into stage 4.
8. Buy the retest and let the mini-cycle play out.
9. Mini-cycle transitions into the higher time frame cycle.
10. Bookmark and Retweet for extra success
Market outlook: It was indeed the bottom.
Since this original post, below $30k, we've rallied to the top of the range at $70k.
1. Where are we now?
2. Altcoins?
3. Targets?
Read along for my views:👇
Target và plan chốt lời cho altcoin mùa này như thế nào là sẽ hợp lý?
$BTC khá chắc chắn là sẽ chạm vùng 150k-200k - tức cap 3000-4000 tỷ!
$BTC dom rớt về vùng 40%, $ETH dom lên lại 20% —> 40% còn lại sẽ dành cho altcoin tức TOTAL3!
vậy altcoin cũng sẽ có vốn hóa 3000-4000 tỷ, hiện tại total 3 đang có vốn hóa 670 tỷ!
Có thể x5-x7 nếu lên vùng 3000-4000 tỷ! —> altcoin x10 đa số là đơn giản, hàng đúng trend sẽ xnxx to hơn
Vậy suy ra plan hợp lý nhất cho anh em:
Altcoin x5 giá hiện hãy chốt gốc để đảm bảo an toàn vốn!
X10 giá hiện tại hãy đảm bảo đã out ít nhất 50% hàng!
Lúc mình tham gia Crypto, không ai nói với mình về 4 giai đoạn này.
Lúc đó (2017) hầu như rất ít người có kinh nghiệm vì thị trường này có khá mới. Những người cũ cũng thua lỗ nhiều nên họ đã chọn cách rời bỏ thị trường
1/15
$INJ moved +800% since stage 4 and we shared it at $8.
Using simple cycle structures will help you spot the coins with a higher probability of parabolic price action.
> What and How?
> 5 Altcoins I'm looking at.
👇
$FET, $WOO, $ROSE, $DYDX & $BLUR
Most profitable Altcoin stages. 👇
People bag holding coins, while it's not profitable in most of the stages they go through.
You want to catch them when the probability on the downside is the least and the parabolic upside the highest.
Everything goes through similar cycles with similar stages.
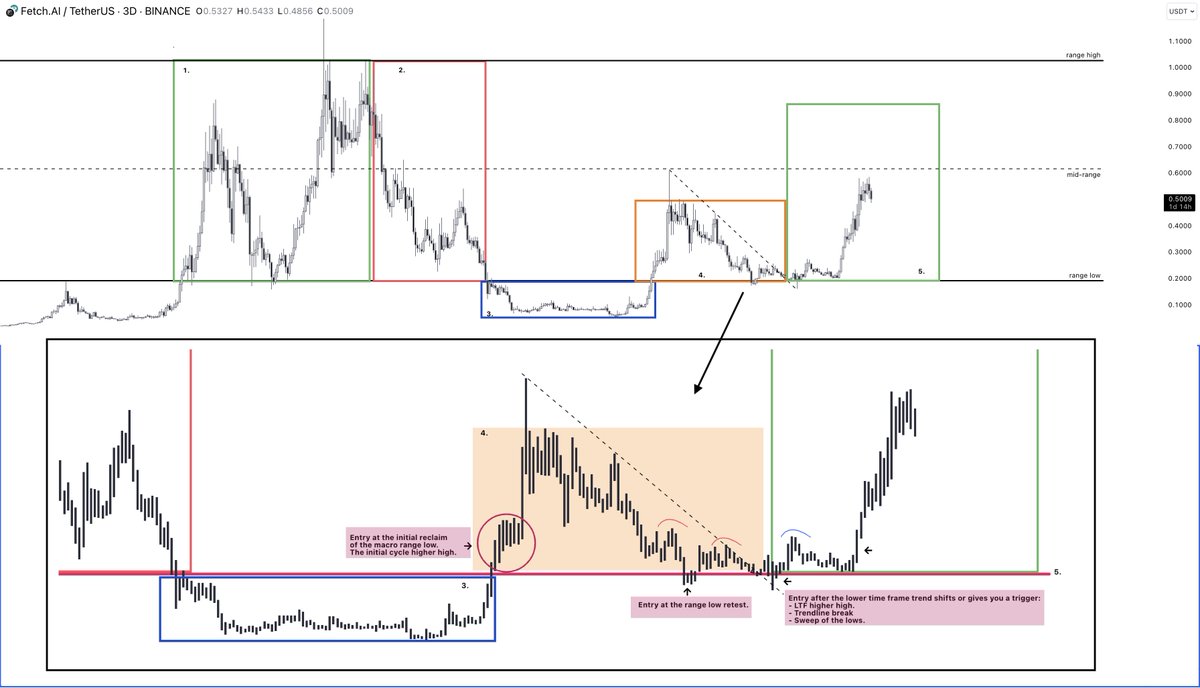
You want to accumulate in the green or orange, stage 3 or 4, as these are the stages where the parabolic upside appears.
Why?
> Less potential downside.
> Less holding time means less risk and opportunity cost.
Stages:
You can spot the stages by looking at the total structure of the macro chart.
1 & 5: the ones with the parabolic upside can be recognized by higher highs and lows.
2: the bear market is recognized by lower highs and lows.
3: can be spotted by transitioning from a vertical downside and sharp lower lows into a more-ranging structure with equal highs and lows.
4: can be recognized by the breakout of the stage 3 range and the initial higher high.
5: it starts when the initial higher highs get broken.
How to enter?
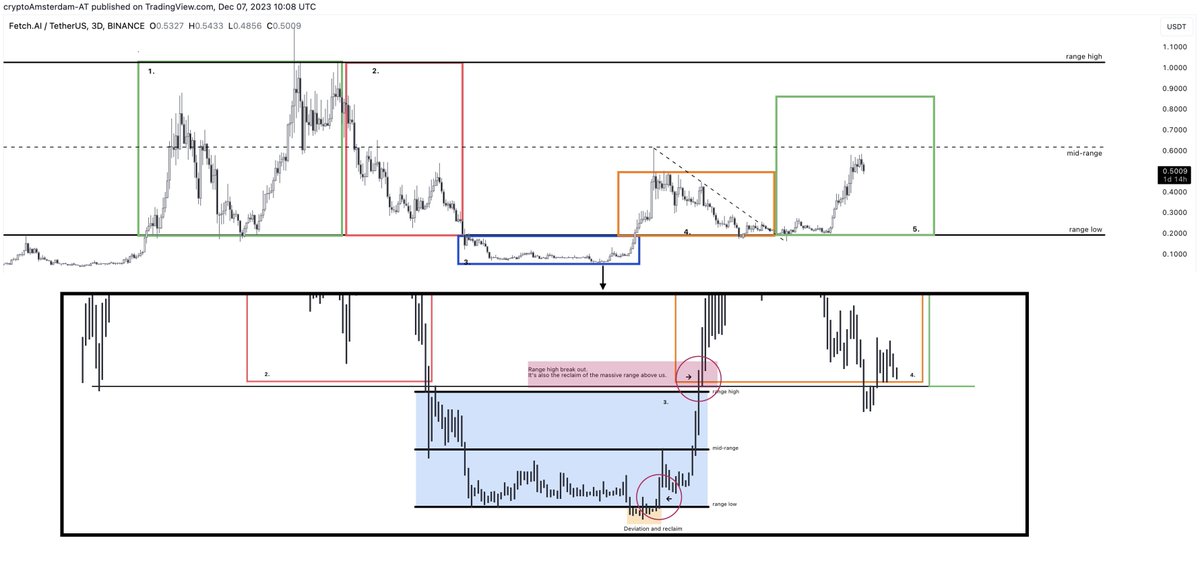
I'll use the $FET | $USDT chart as an example.
> Let's start with finding your entry in stage 3;
Stage 3 can be seen as a range. In a range, you either want to enter at the lows of the range or after a clean range high break out.
You want to avoid ending up buying the range high resistance.
> Buy the range low at a retest after it's established.
> Buy the reclaim after a deviation at the range low.
> Buy the range high break out and initial market cycle higher high.
Let's take a look at stage 4:
Stage 4 can be seen as the initial cycle higher high after the bear market lower lows and range period after.
> Buy the initial break out of the range of stage 3, which is also a reclaim of the HTF range above.
> Buy the retest at the HTF range low after the initial cycle higher high has been formed. We expect and look to get in at the initial cycle higher low.
> Wait for some trigger: the sweep of the lows, a trendline break, or an LTF price action shift.
Bonus:
Can you see the cycle structure also playing out if we zoom in on stages 4 and 5 on the lower time frame?
The type of cycles play out in every time frame. They can help you spot the better swing trades on the higher time frame and with your entry on the lower time frames.
Missed $INJ, $METIS, and $BTC?
This setup made me buy Bitcoin at $18,000 and many other winners.
1 - How to use it.
2 - Cycle super reclaim. (the big winners)
3 - Five super reclaims right now!
This is simple and all you need right now.
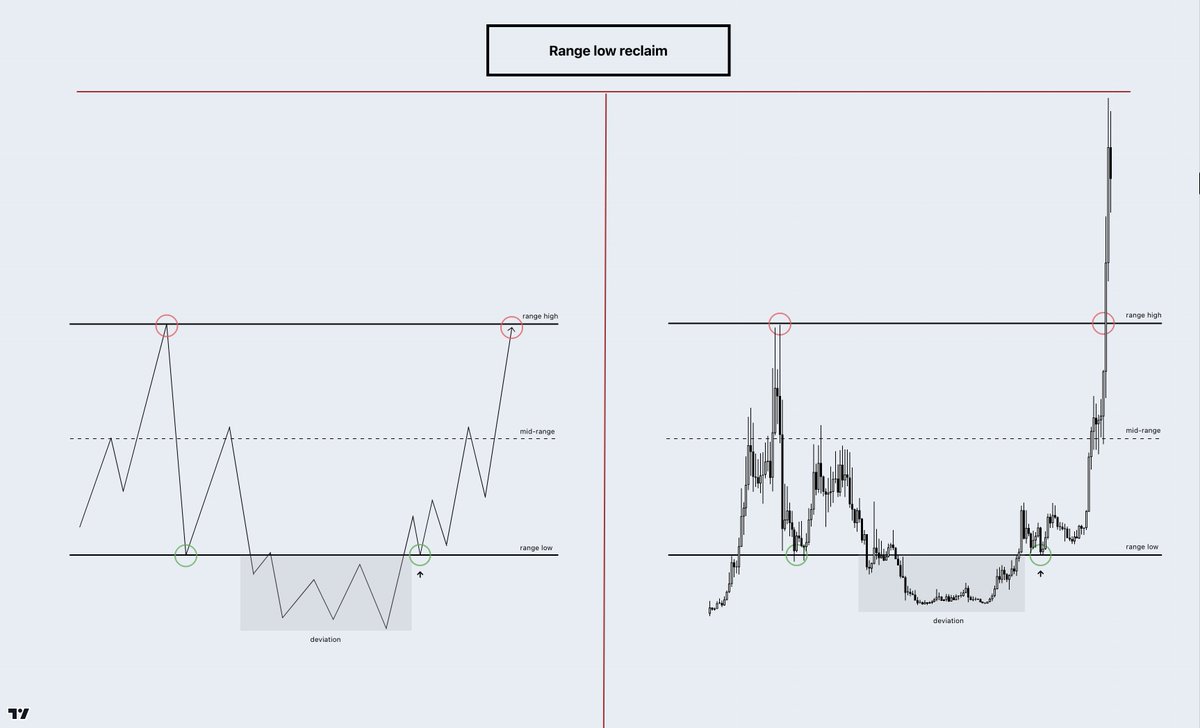
> The range low reclaim: 👇