My favourite buy area's are the @OliverKell_ EMA crossback spots.
Two examples from last April that I bought in HOOD PLTR.
This is the kind of action I'd like to see in a lot of the tech stuff.
I don't care about catching the lows.
Let them show some strength by getting back through the MA's and then look for that tightness above them. Great R/R spot lower in the base
If you're looking to short this market, you want to do it into supply, not into the washout.
We'll know soon enough whether this rally has real legs. If these 3-5 day oversold bounces run into resistance and begin to stall, that's where I want to be putting on short exposure.
$CIFR was the first name I stepped into today. If this market is headed lower, that's exactly the type of setup I want to be trading.
On the other hand, if this market is truly ready to move higher, it should reclaim the 50-day moving average, continue building out the right side of these bases, and we will see volatility compress. That's the environment where swing trades becomes much higher probability.
Until then, I'm letting price prove itself.
Notice how every decent leg up in the QQQ since 2020 has come when the stocks above 50MA has hit at least 30.
Ideal scenario for me is we see more selling and get this down to at least 30 area, get majority of people max bearish and then see leading stocks start to detach from the indexes.
Could be weeks or months, all we can do in the meantime is be patient, not get chopped up, and keep up with our daily processes to identify those bucking the trend and the next groups that will lead us higher.
You cannot outsmart the moving averages...
The market is showing, why its so incredibly important to have a proper exit strategy
Many stocks that ran 100%+, now back to the exact spot they were a few months ago
You can avoid round tripping those gains using the EMA's
Simple exit strategy:
-Trim into strength/key level (25%)
-Close under 8 EMA (25% trim)
-Close under 21 EMA (25% trim)
-Close under 50 EMA (50% trim)
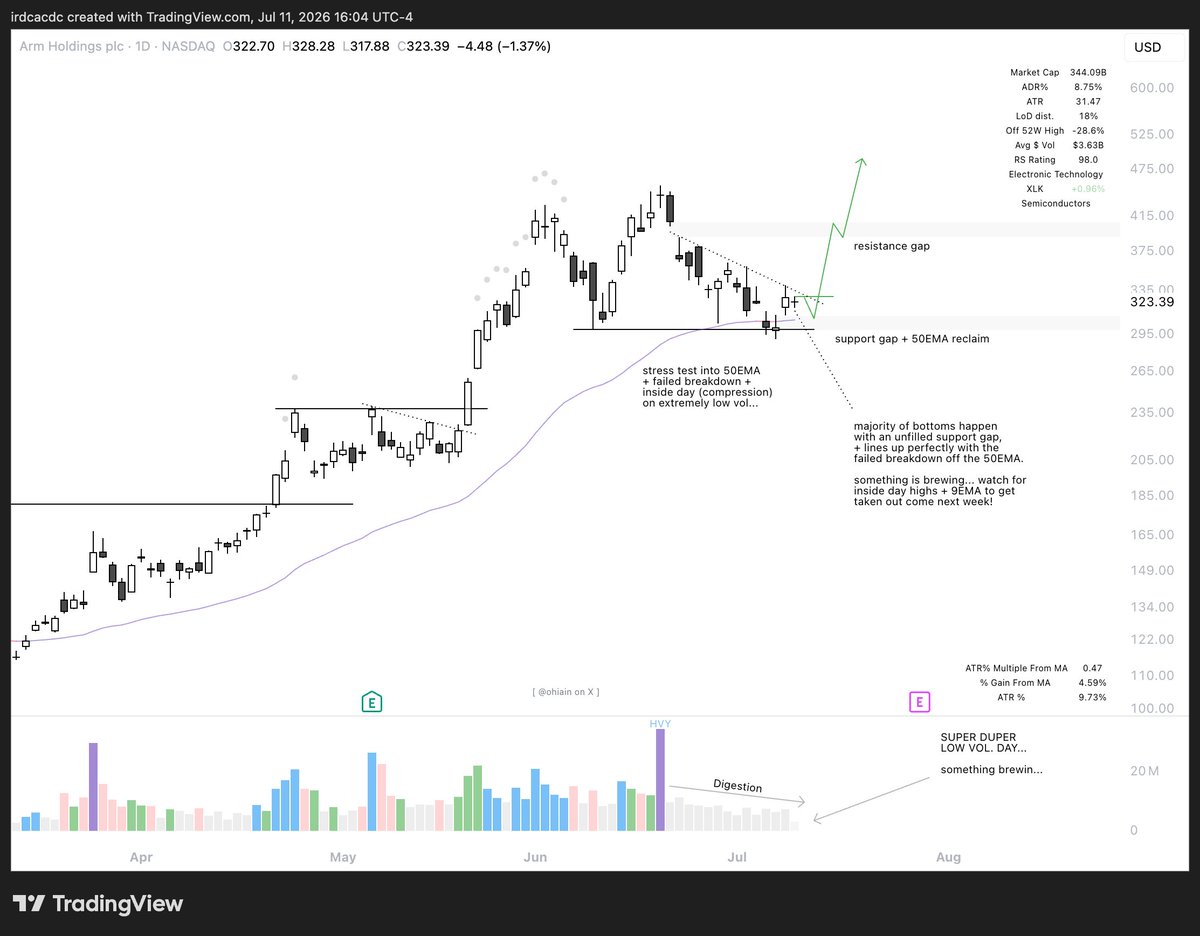
(You can also trim on the way up on extensions like $ARM)
This saved me a MASSIVE roundtrip on a few of my best trades this year
Goal is not to sell the tippy top...
Its to ride the momentum of the trend for as long as possible
NEW VIDEO: My current take on the markets I discussed with @Deepvue subscribers yesterday
Rotation INTO cybersecurity, biotech & genomics
Rotation OUT of AI, SMEs & gold miners
Market cycle: No definitive trend, choppy above/below the 21-day SMA
S&P 500 as the leading index — big caps driving the action
Summer seasonality: Why late June to early August is historically dull
Earnings season: How I'm using my HV Edge watchlist to prepare
https://t.co/dXbwKSdq0N
4 best entry models for swing trading:
1. Breakout
Price breaks over a key level of resistance usually out of a big daily base
-Enter on the break above key level
2. 30m pivot pullback entry
Buying a strong leading stock when it pulls back to an EMA, trendline, or support zone.
Using the 30m pivot to confirm strength
-Wait for price to retest key level
-Wait for first 30m green candle to form off pivot
-Enter on break of 30m candle highs
3. Undercut and Rally
Price breaks down out of a base but fails to push lower instead reclaiming the lows of the base
This traps sellers, and forces early longs to stop out creating a big sweep
-Find a leading stock setting up in a big base
-Wait for the support level to break
-Reclaim of the key support level for entry
4. Anticipation Entry
Entering before a breakout, usually inside a tight consolidation where price gets super tight into the right side of the base
Price structure will be incredibly tight.. usually inside day being printed at the top of the base
-Enter near the end of the day on a strong close
$INTC (Update) — Continue to remain weak, couldn't hold a gap up and faded in less than 30mins. Currently $105 and $100 breakdown would be a bearish double top pattern in play.
If you've followed me for any length of time, you already know...
I'll happily let everyone else fight over the left side of the V.
Give me the right side every single time.
I made this graphic back in January to better illustrate exactly what I mean:
If the market does start turning higher as early as next week, my #1 priority will be buying the RS leaders from this correction.
The strongest stocks during a corrective phase are usually the first ones institutions go back to when risk appetite returns, so don't overcomplicate it...follow the relative strength.
Create your own simplified process:
- scan for RS names →
- build a watchlist →
- stalk tightness + asymmetric entries →
- wait patiently →
- execute if the setup triggers →
- patience →
- take trims →
- move stops to breakeven →
- more patience →
- go touch grass! →
- then keep being patient.
etc...
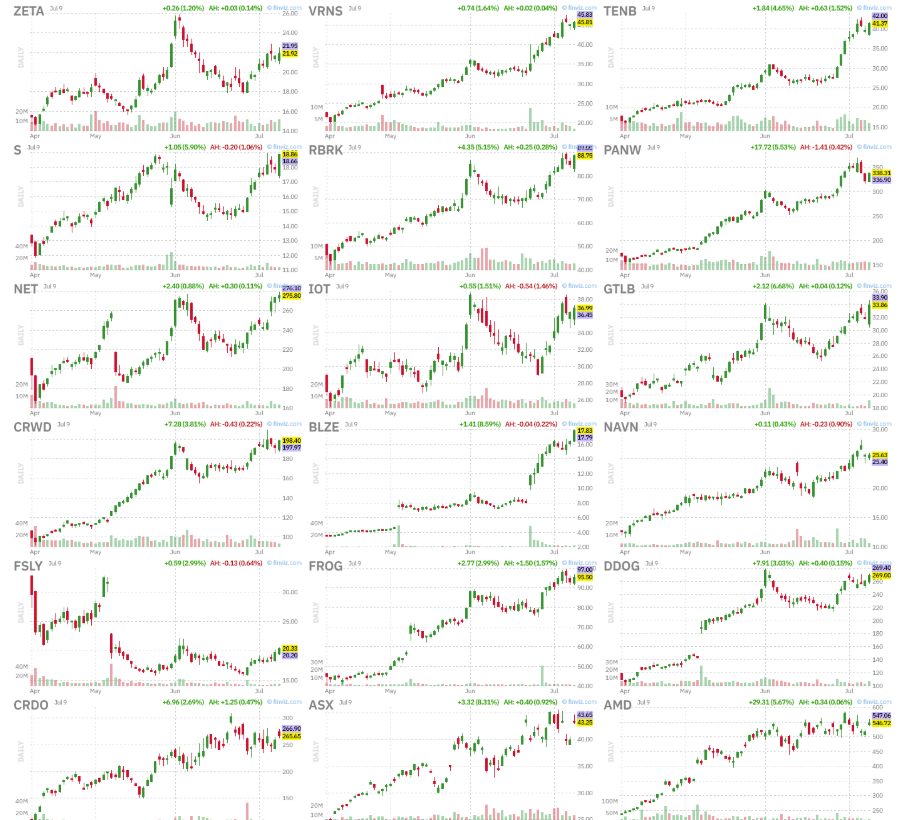
A few liquid names I'm stalking are $AMD, $DELL, $ANET, $MRVL, $AMZN, $ARM + $ALAB, but I've got plenty more on the watchlist.
Chart: $MRVL, $ARM, $AMD, $ANET.
The one thing that has completely changed my trading?
Rating my setups
I used to see a setup that looked ok and take the trade just because it looked good..
Now I don't take a trade unless its 4+ stars
The rating system:
1. Stage analysis ⭐
Is the stock coming out of a stage 1 base or in a stage 2 already?
The stock should already be in a strong trend
2. Moving averages ⭐
Price must be above the 21 EMA, and 200 SMA to get another star
3. Tight consolidation ⭐
Price need to form a tight range of no more than 1.5x ADR% just below the breakout level.
Base must be mature / At Least 2 weeks of consolidation
4. Market environment / Sector strength ⭐
Correlating index/sector should be above the 8/21 EMA’s and in strong trend
If a strong tech stock is setting up well but the market is under the 50 EMA it losses a star
5. Entry Quality / Risk-Reward ⭐
Am I buying at the proper trigger?
Am I chasing?
Can I define my stop?
Is there room to my first target?
Focus on 5 ⭐ setups
If trading a 4⭐setup reduce size
What are the signs CRYPTO has bottomed? And what is my next highest conviction opportunity?
My podcast segment from last Thursday.
See the relative strength and signs before everyone sees it and wants in months later.
When I first started trading I was completely lost
I soon realized that the best traders in the world all focus on 1 thing:
Tight price action or the VCP (Volatility contraction pattern)
When I discovered this concept everything changed..
I stopped chasing random moves.
I started searching for tightness.
Price is like a spring:
-It compresses
-Volume decreases
-Higher lows are made
This builds energy for the next move up
the tighter the coil, the bigger the potential release, and our job as traders is to recognize that energy building.
Then position yourself when the spring explodes.
Train you eyes to search for this tightness and it will change the way you trade
🚨 Presenting the Strong Start RVOL Dashboard TradingView indicator, free for everyone!
Paste a watchlist → it ranks every name by RVOL & stars the ones that have a strong start
- Credits to @FreeThinkEd for the original script on which this is based
- Credits to @imanasarora for the strong start concept
Appreciate the kind words and subscribing to our community. I’m making this reply public as the 3-stop strategy within T+3 has now been adopted by quite a number of traders — it’s only fair that everyone understands my statement: “If your win rate is below 40%, your top priority should be reducing your losses further.” Performance can be enhanced from loss management if bulk of your trades are slated to be losses, a reality that most of us need to accept as traders to our system as a business cost.
In the display below, I show two different stop-loss applications and their resulting drawdowns, based on a 28% win rate over a 500-trade sample size. The time range of these trades depends on your own strategy — intraday traders, for instance, can easily accumulate 500 trades in under 3 months.
The real value of the 3-stop strategy doesn’t appear in just a handful of trades. It’s a long-term discipline that requires consistency and repetition to gradually reduce your drawdown, as shown here.
Scan for Relative strength line new highs, and new highs before price, as well as names that close near highs of the day will be key tells for what the leaders are.
This one candle made me over $100k last month
The 30m pivot
In this video I cover:
-Using the 30m pivot to catch reversals
-How to find the right stocks to use it on
-How to stack your probabilities to get A+ entries
One of the most important videos I've made
https://t.co/0QuEUZ3pfJ