I came. I saw. I cried. I doubted. I endured. I grew. I served. I CONQUERED! 🇳🇬🎓❤️
NYSC wasn’t perfect, but it made me stronger. 12 months of lessons, resilience, and growth. Today, I celebrate the victory.
NYSC: OFFICIALLY DONE! ✅🥂
#NYSC#POPOfficially
12 months. Countless lessons. A new chapter🎓🇳🇬
Grateful to God for the journey. My NYSC POP is here! 🙏
📅 Thursday, Oct. 29 | 10 AM 📍 Peace Park, opposite Government House, Yenagoa, Bayelsa State.
You’re invited,Come celebrate with me🎉
#NYSC#POPLoading
12/12 MONTHS COMPLETED🇳🇬🎓 Grateful to God for the lessons, growth, and strength throughout my NYSC journey. POP loading… October 29th🙏🎉 #NYSC#POPLoading
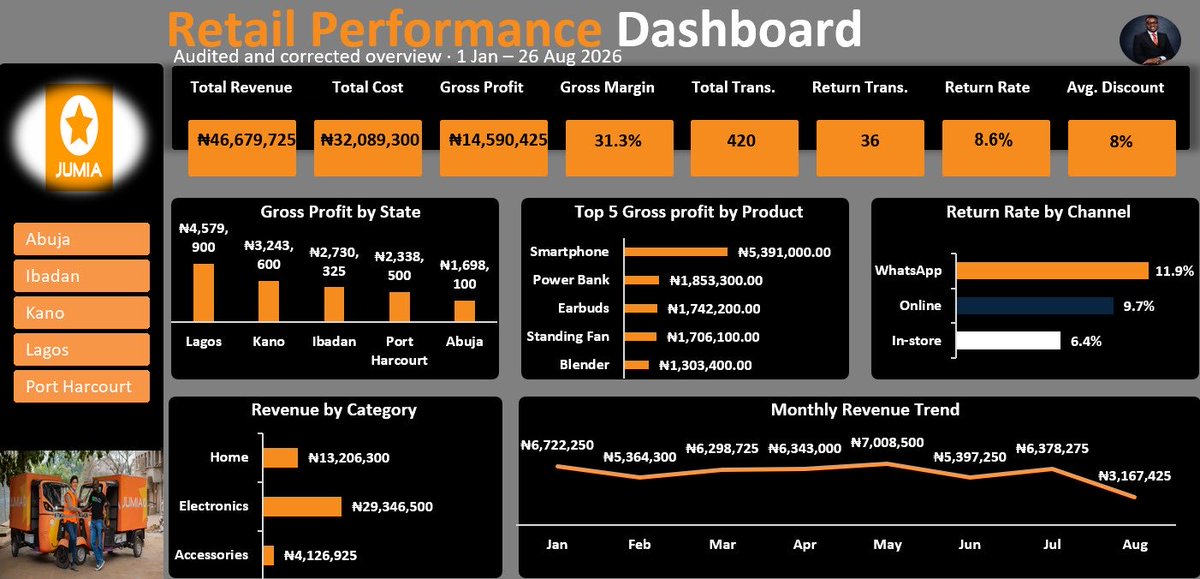
I was given a dashboard management already trusted, with 4 conclusions they were ready to act on.
I audited it. All 4 were wrong.
The biggest culprit? 31 blank cost cells treated as ₦0. That alone created ₦1.5M of phantom profit and made Abuja look like the #1 market. It's actually last.
Built in Excel 🧵👇
Thread continuation:
2/ Before trusting anything, I cleaned the data line by line:
12 duplicate transactions
"Lagos" spelled 3 ways
22 revenue figures that didn't match their inputs
31 blank costs counted as free
3/ Management's claims vs. reality:
❌ Abuja is most profitable. It's last of 5. Lagos leads.
❌ Discounts boost profit. Margin fell from 35.7% to 15.3%.
❌ Online has the lowest returns. In-store does (6.4%).
4/ Lesson: a dashboard can look polished and still lie. Blank cells don't look like errors on a chart. They just quietly inflate numbers.
Full project: [ https://t.co/ytiF7z0psN]
One thing I've learned as a Data Analyst:
Don't immediately “fix” every problem you see in a dataset.
A missing value, negative number or duplicate record needs context first.
Data cleaning isn't just making data look clean.
It's making sure you can trust it.
Been quiet for a while.
I took some time to step back, reflect and figure out my next move.
Now I'm showing up again.
I'm approaching the end of NYSC and actively looking for my next opportunity in Data Analytics.
Back to learning, building, connecting and applying.
One step at a time. 🙏🏾
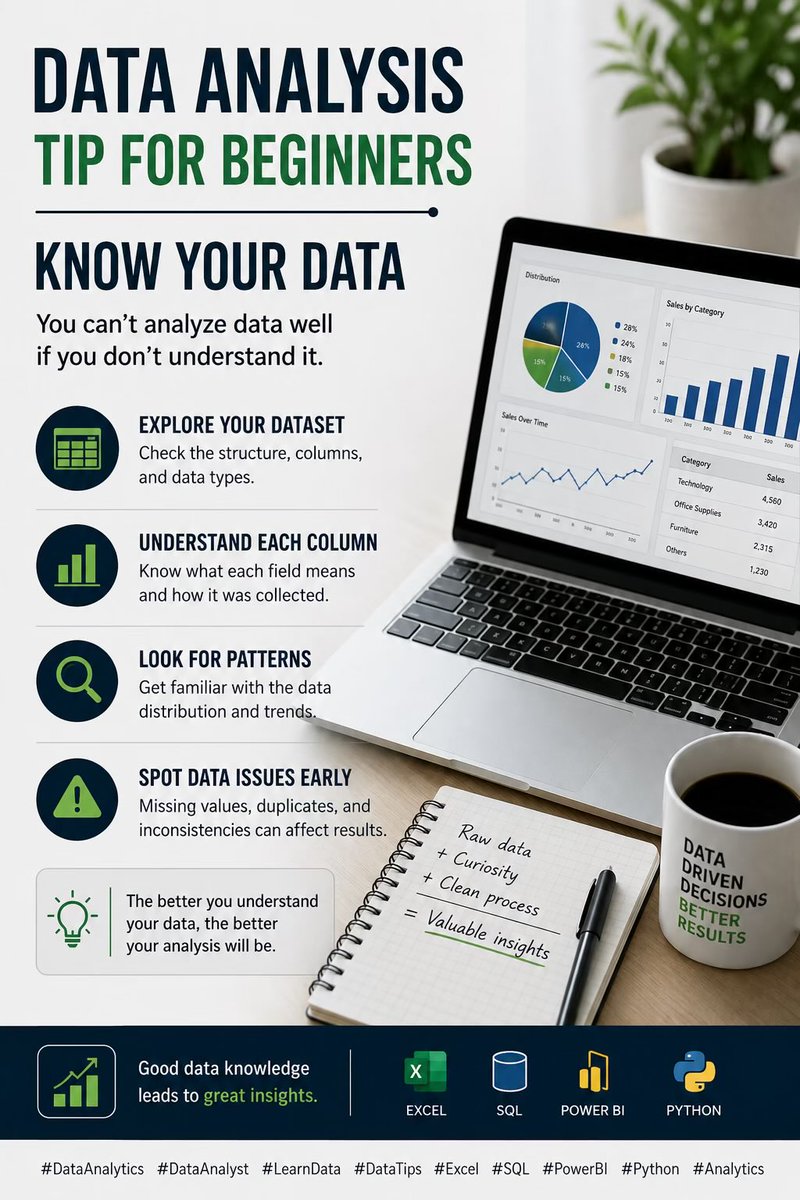
A data analyst should never blindly trust raw data.
Before creating dashboards or running SQL queries, check for: • Duplicates • Missing values • Wrong data types • Inconsistent entries • Formatting errors
Clean data = reliable insights. 📊
What do you check first?
#DataAnalytics #DataAnalyst #Excel #PowerBI #SQL
Want to become better at data analyst? Start with Excel formulas. 📊
SUM, AVERAGE, IF, COUNTIF, VLOOKUP, CONCAT, and SUMIF are simple but powerful tools for analyzing data efficiently.
Don’t just memorize formulas, understand when and why to use them.
#DataAnalytics#ExcelTips #DataAnalyst #LearnExcel #ExcelSkills
Excel is more than rows and columns. 📊
For aspiring data analysts, mastering formulas, PivotTables, data cleaning, visualization, and shortcuts can make your workflow faster and your insights clearer.
Small skills. Big impact.
#DataAnalytics#ExcelTips#DataAnalyst#DataCareer #LearnExcel
The right tool can make your analysis faster and more effective. 📊
Excel, SQL, Power BI, Tableau, and Python each have their strengths. Don’t try to master everything at once, learn what solves the problem in front of you.
#DataAnalytics#DataAnalyst#DataTips#LearnData #Analytics
Data analysts don’t just analyze numbers. 📊
We turn data into stories that people can understand, remember, and act on.
The real skill isn’t just finding insights, it’s communicating them clearly.
#DataAnalytics#DataAnalyst#DataStorytelling#DataTips#LearnData
📊 A dashboard shouldn’t start with charts. It should start with a plan.
I just dropped a new tutorial on **Dashboard Wireframing using PowerPoint**.
I’ll show you how I use:
📌 PowerPoint to plan the dashboard layout
🎨 Pick Color to choose the right color palette
💡 Pinterest for dashboard design inspiration
Before building in Excel or Power BI, wireframe it first.
🎥 Watch the full tutorial:
https://t.co/xbIURjqYpD
If you're learning Data Analytics, this one is for you. 🚀
#DataAnalytics #DataAnalyst #PowerBI #Excel #DashboardDesign
Great data analysis starts with the basics. 📊
Before jumping into Excel, SQL, or Power BI, learn to ask the right questions, understand your data, clean it properly, and communicate your findings clearly.
Tools help. Critical thinking makes the analyst.
#DataAnalytics #DataAnalyst #DataTips #LearnData #Tech
Clean data leads to better insights. 📊
Before analyzing any dataset, check for missing values, duplicates, inconsistent formats, and outliers.
Good analysis starts with clean, reliable data.
#DataAnalytics#DataAnalyst#DataCleaning#DataTips#PowerBI
🚀 New YouTube Tutorial
Want to analyze thousands of rows in Excel without writing complex formulas?
In this video, you'll learn:
✅ Pivot Tables
✅ Pivot Charts
✅ Slicers
✅ How to build an interactive Excel Sales Dashboard
Perfect for beginners and aspiring Data Analysts looking to level up their Excel skills.
🎥 Watch here:
https://t.co/FebkpTLHkg
If you enjoy the tutorial, please like, repost, and subscribe to the channel for more practical Excel, SQL, and Power BI content.
#Excel #DataAnalytics #DataAnalyst #PivotTable #ExcelTips #MicrosoftExcel #PowerBI #SQL #LearnExcel
This is short enough for X while still delivering value and encouraging clicks.
Knowing Excel formulas is a skill.
Knowing which formula solves the business problem is the real advantage.
Companies don't hire analysts to remember functions.
They hire analysts to make better decisions with data.
#Excel#DataAnalytics