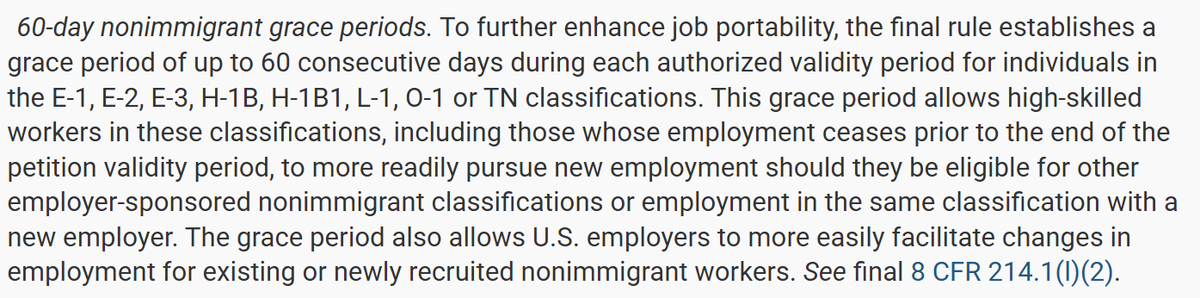
@PFIRorg Anybody could blame immigration lawyers all they want, but it was DHS who laid out why a 60-day grace period was necessary, not immigration lawyers. And, by the way, the reasons were to help employers as well, not only immigrants.
You can read it here: https://t.co/8LNvvWPPE2
I would agree that eliminating the grace period increases employer leverage over H-1B workers. Trafficking law already recognizes visa-tied employment as a classic facilitator of coercion. Remove the grace period, and the practical threat an employer can make (like, "cross me and you're out of status immediately, not 60 days") becomes sharper and more immediate. DOJ's Civil Rights Division already runs a dedicated portal for workers coerced under visa programs.
I don't know about other states, but California is an at-will employment state (Labor Code §2922). It means that the "current employer could be finding out they are losing a team member on extremely short notice" regardless of the existence of a grace period.
I am not arguing against the grace period per se, but from an employer's perspective, especially in California, it is a weak argument.
Also worth mentioning is that the 60-day grace period came out of the Obama administration's November 2016 rulemaking package. Before this rule, the moment employment ended for any reason, the worker was technically out of status immediately, even if their I-94 said they had months left. At that time, DHS laid out a few good reasons for the grace period:
1) H-1B workers were effectively trapped with one employer because losing that job meant near-instant unlawful presence exposure, which in turn gave employers outsized leverage over these workers (on wages, working conditions, etc.);
2) DHS already allowed 10-day grace periods at the start/end of H-1B validity periods for travel and wind-down purposes.
3) DHS also noted the rule allows U.S. employers to more easily facilitate changes in employment for existing or newly recruited nonimmigrant workers who are already physically present in the U.S., avoiding lengthy delays associated with recruiting talent from abroad.
All in all, it would be interesting to see what justifications (if any) DHS will write down for eliminating the grace period, considering they were for that period 10 years ago.
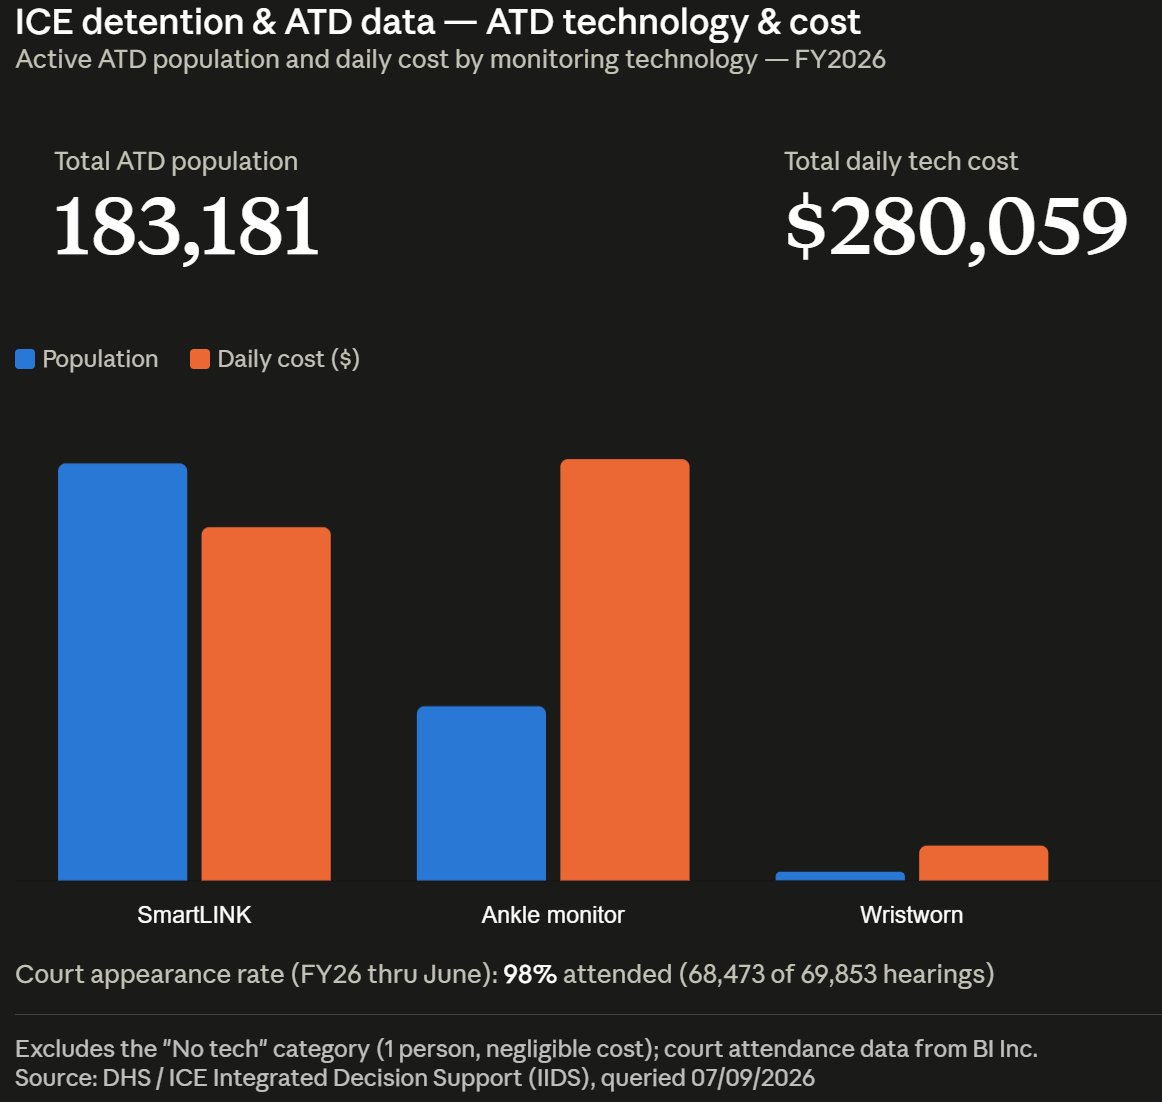
SmartLINK app monitoring covers the largest share of the ATD population (127,296), but ankle monitors, used for far fewer people (53,192), cost more in total daily spend ($145,746 vs. $122,204), reflecting a higher per-person cost for the physical device.
Compliance is high across the program: 98% of the 69,853 scheduled court hearings this fiscal year (through June) were attended.
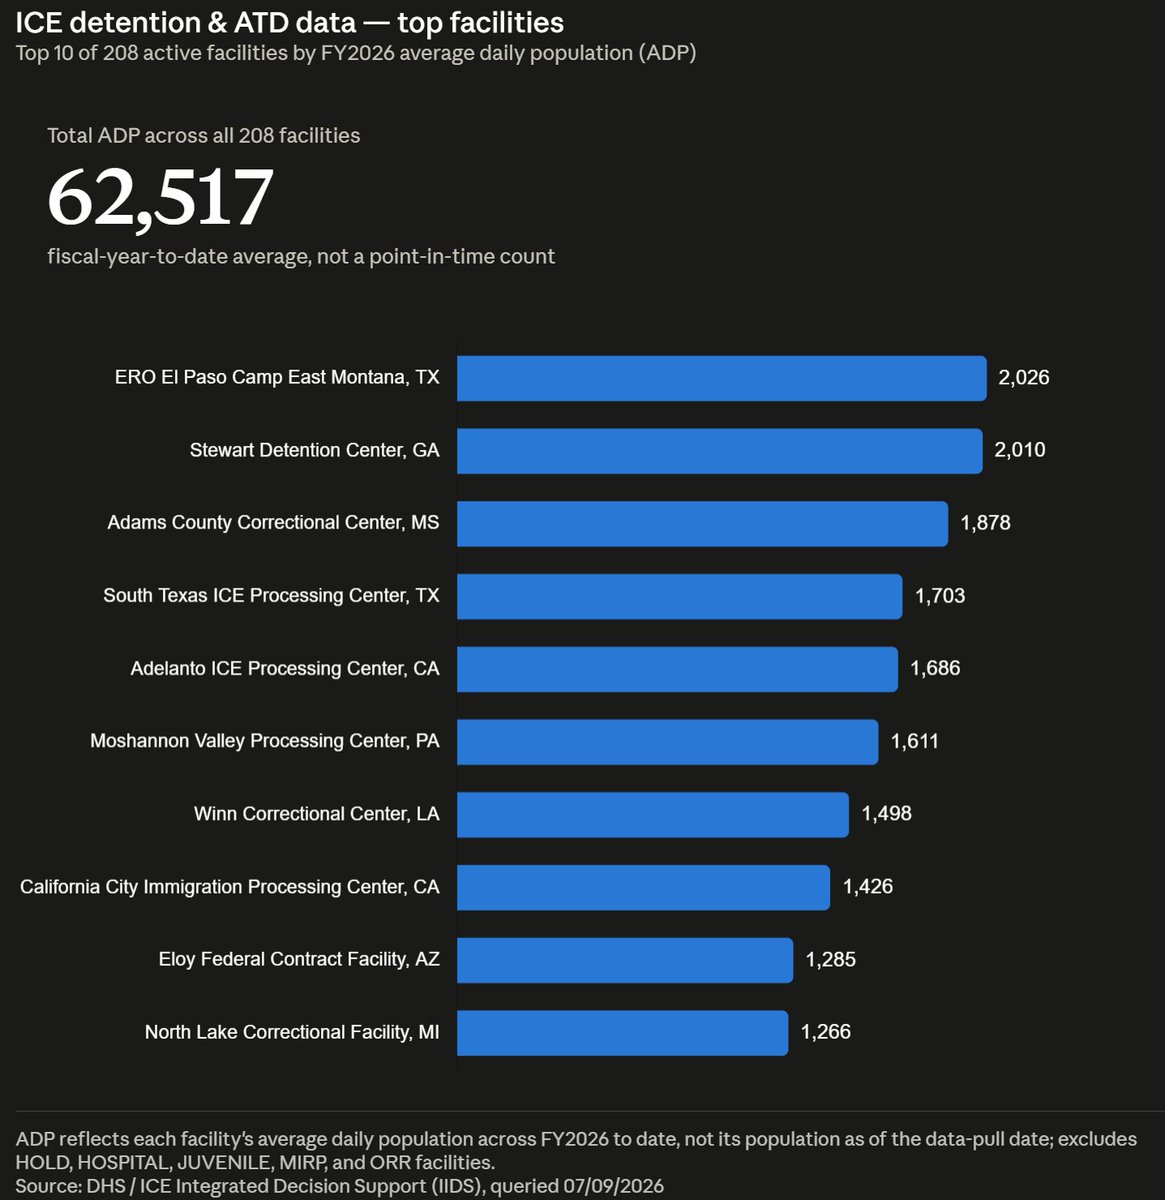
Across 208 active facilities averaging 62,517 people daily this fiscal year, the population is fairly concentrated at the top: ERO El Paso Camp East Montana, TX (2,026 ADP) and Stewart Detention Center, GA (2,010) lead, with Texas, Georgia, and California each landing multiple facilities in the top 10.
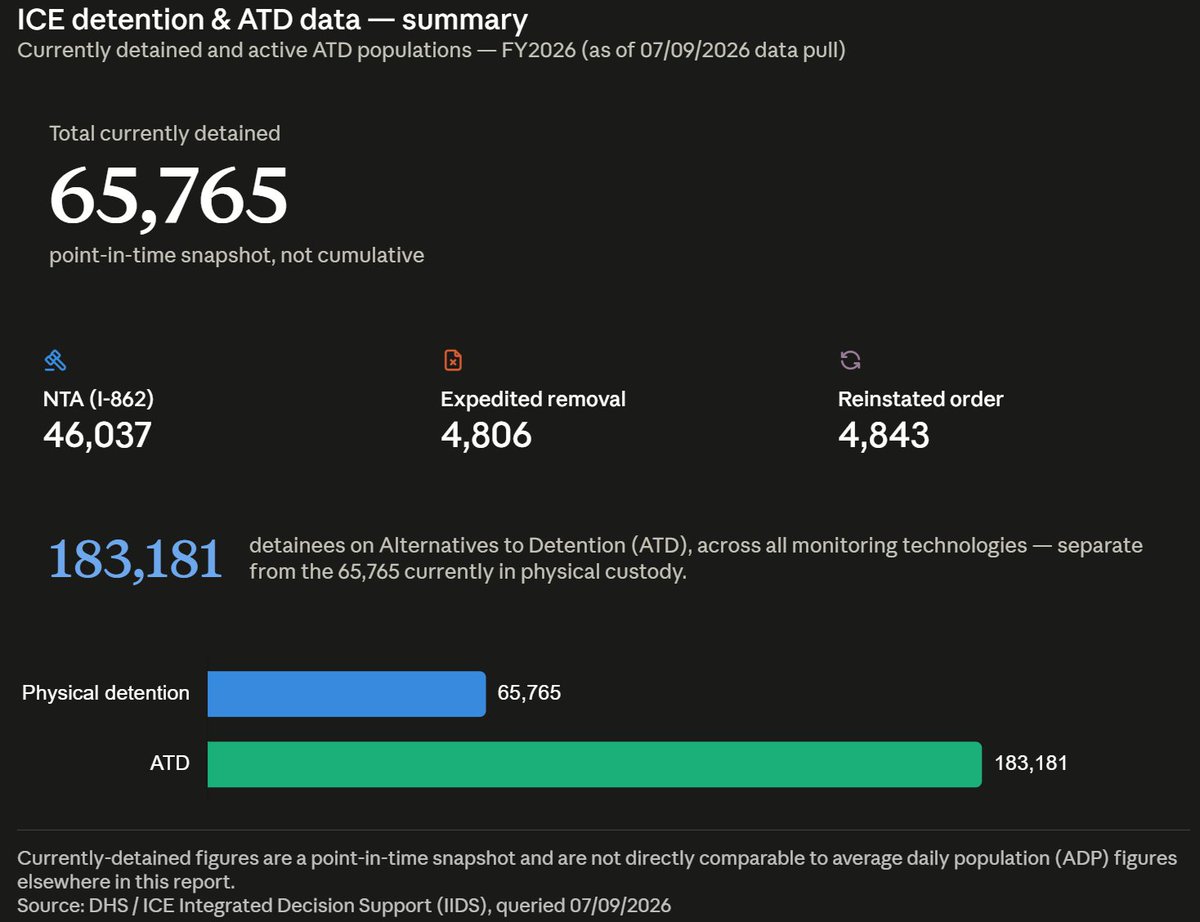
Recently DHS published Detention Statistics. As of the 07/09/2026 data pull, ICE had 65,765 people in physical detention (46,037 on a Notice to Appear, 4,806 in expedited removal, 4,843 on reinstated removal orders, the rest under other processing dispositions).
Plus another 183,181 on Alternatives to Detention — nearly three times the physically detained population is being monitored in the community instead.
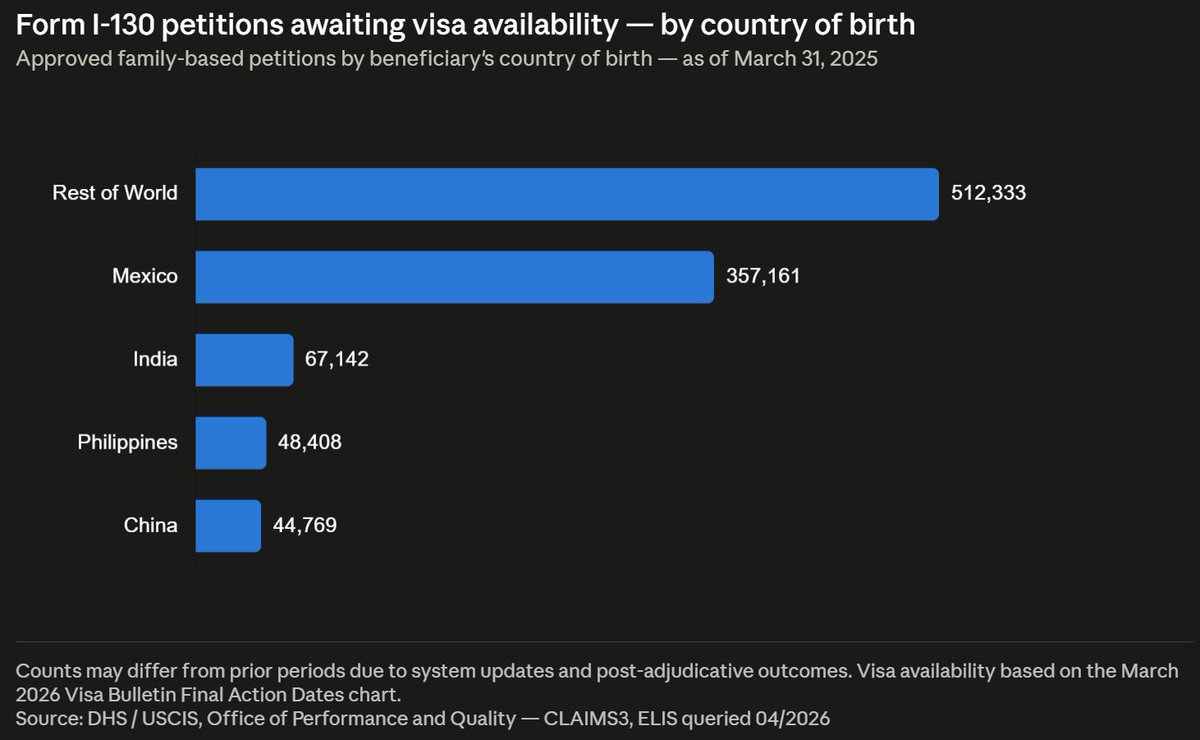
Geographically, "Rest of World" and Mexico together account for roughly 85% of the total backlog.
Mexico alone (357,161) is more than five times India's total, despite India often dominating headlines about visa backlogs.
China, India, and the Philippines are each well under 70,000, comparatively minor slices of this particular queue.
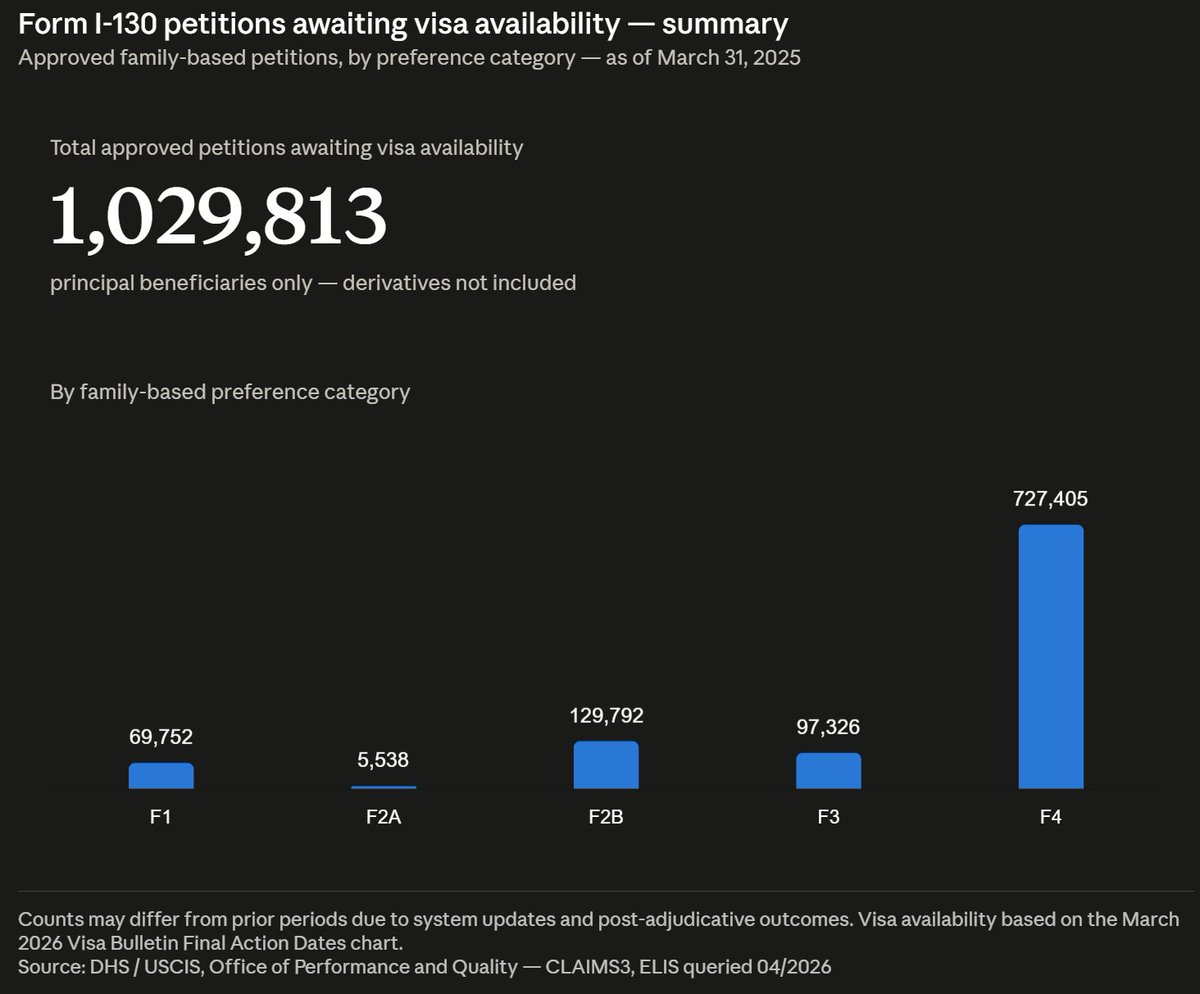
Nearly 727,405 of the ~1.03 million APPROVED I-130 petitions sit in the F4 category alone (siblings of adult U.S. citizens). Over 70% of the entire backlog is concentrated in that single preference category, even though it's just one of five.
F2B and F3 are a distant second tier, and F2A (spouses/children of LPRs, the fastest-moving category) is comparatively tiny.
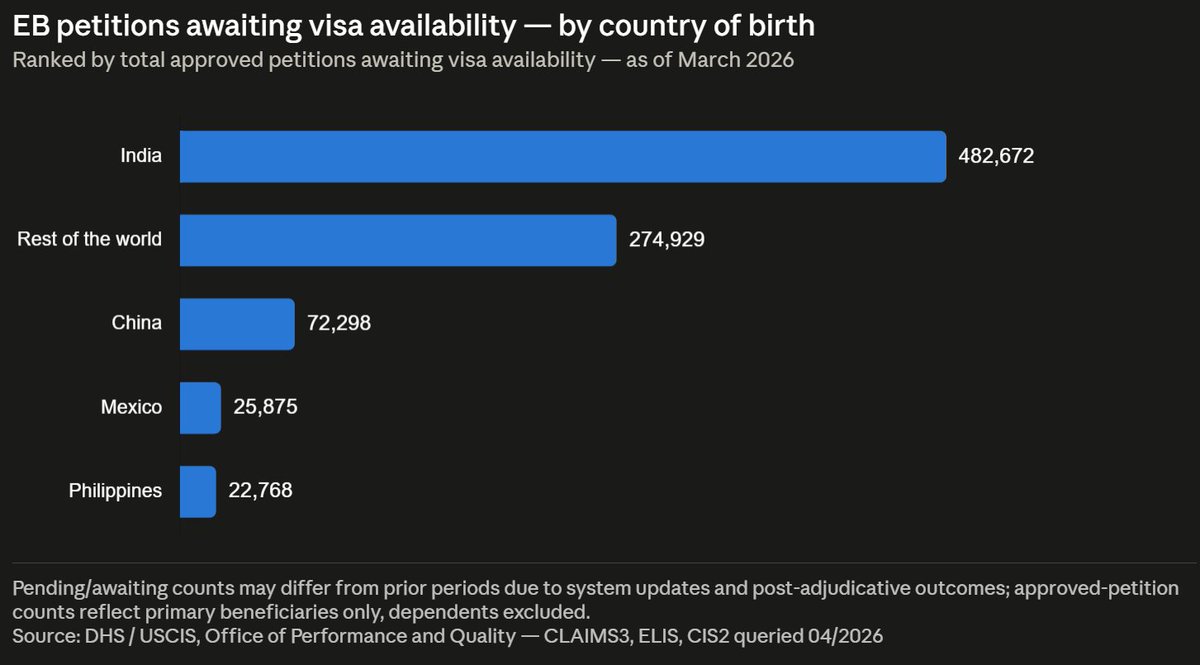
By country of birth, India dominates the backlog at 482,672 petitions, 55% of the total petitions.
It is followed by the rest-of-the-world grouping at 274,929 (31%).
China trails far behind at 72,298, with Mexico and the Philippines each under 26,000.
India's concentration is especially pronounced in EB-2 (351,142 of the category's 391,561 total, per the workbook), which is the main driver behind both the EB-2 and India rankings.
In Q2 2026, of the 878,542 approved I-140, I-360, and I-526/E petitions currently awaiting visa availability as of March 2026, EB-2 (advanced degree professionals) alone accounts for 391,561 — 45% of the entire backlog.
EB-4 special immigrants is a distant but sizable second at 229,710 (26%), while EB-3 professional/skilled adds another 157,167. The EB-5 investor set-aside category shows zero petitions waiting, and EB-4 religious workers is negligible at 2,541.
For I-526E, China (1,294) and India (1,282) are nearly tied at the top, together making up 76% of receipts. It is a much tighter race than on the standalone form.
Rest of the World (409) is a distant third, and South Korea, Taiwan, and Vietnam each contribute roughly 100–165 receipts, a meaningfully broader geographic base than I-526 shows.
I-526E (regional center) is a much larger volume with 3,387 receipts YTD, roughly 20x the standalone form. Here the mix flips: Rural Area leads (1,878, 55%), ahead of High Unemployment Area (1,142, 34%), with Rural + High Unemployment Area (244) and Unknown (110) as smaller tails.
Infrastructure again drew zero receipts.
By country of birth, I-526 receipts are dominated by China (67) and India (62), together accounting for 75% of the total, with "Rest of the World" the only other meaningful contributor (42).
South Korea, Taiwan, and Vietnam saw negligible standalone-investor activity this period.
I-526 (standalone investor) drew 172 receipts across FY2026 Q1–Q2, with the bulk concentrated in the High Unemployment Area set-aside (126, or 73% of total). Rural Area and Unreserved trail well behind, and the Rural + High Unemployment Area and Infrastructure categories saw zero receipts this period.
I-129 alone accounts for roughly two-thirds of all I-907 requests this Q2 2026 (100,136 of 147,435), more than double I-140's share.
Across every form the concurrent-to-upgrade ratio stays fairly consistent — roughly 3-to-1 — except I-539, where upgrades make up a slightly larger share (35%) than elsewhere, though its total volume is small next to the other three forms.
Q2 2026 quarter's I-907 volume ran heavily concurrent: three out of every four requests were filed alongside the underlying petition rather than as a later upgrade of a pending case. I-129 (nonimmigrant worker petitions) drove the bulk of that volume by itself.
The intracompany transfer categories draw by far the most scrutiny: L-1B tops the list at 28.7% RFE rate and L-1A follows at 25.2%, with O (extraordinary ability) and Blanket L close behind, all well above the 11.6% overall average.
The high-volume classifications sit at the other end: H-1B (140,850 receipts, the single largest category) has one of the lowest RFE rates at 8.9%, and H-2A is lowest of all at 7.5%.
So the burden of USCIS's evidentiary scrutiny is falling disproportionately on the L-1 and O petition categories rather than on the classification that gets the most filings.
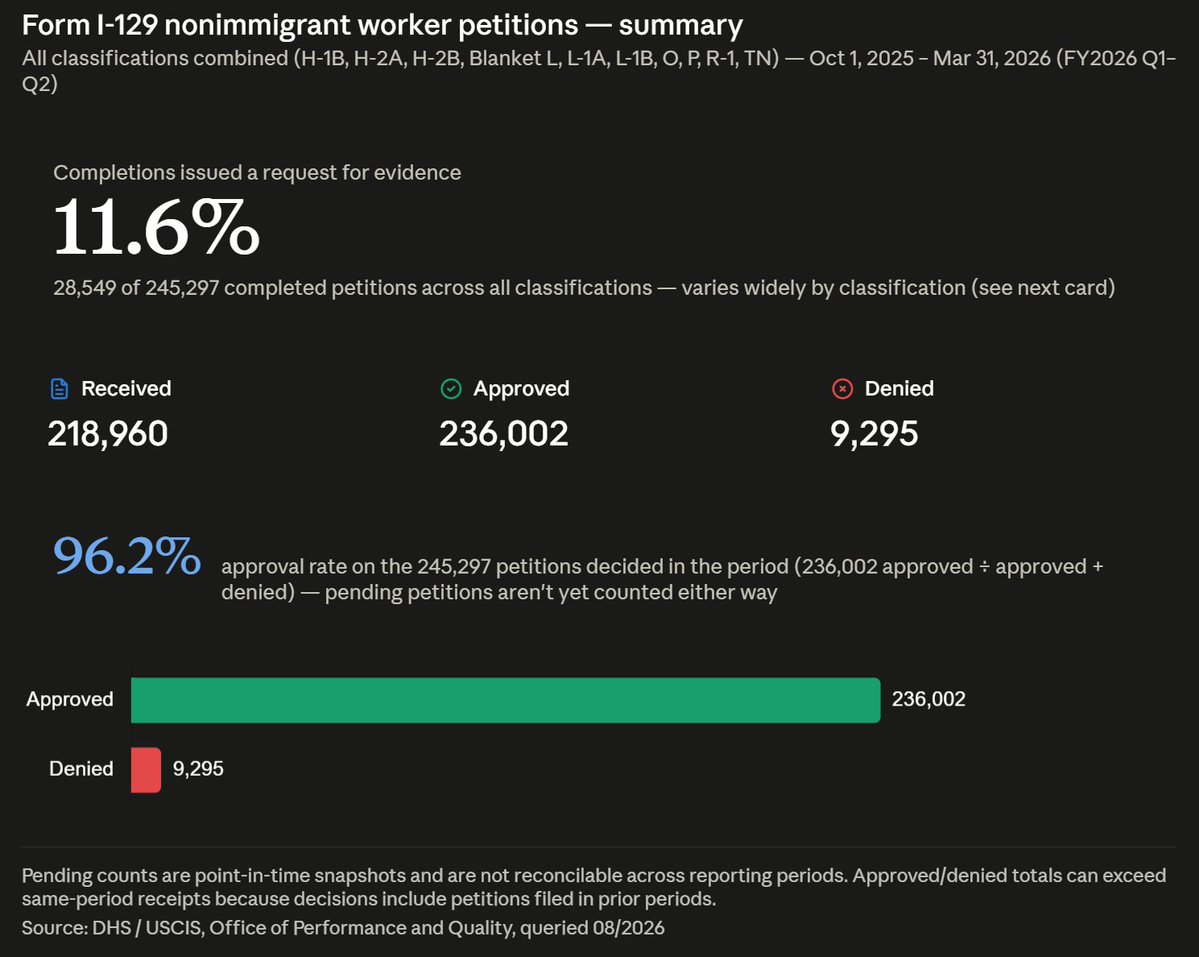
Across all ten I-129 classifications combined, USCIS issued RFEs on 11.6% of completed petitions this reporting period, and the overall approval rate on decided cases stayed high at 96.2%.
At the field-office level, Houston (30,125 pending) and Dallas (25,589) carry the two largest backlogs by a clear margin, followed by Chicago (19,893). Together these three offices alone hold roughly 76,000 pending N-400s — about 11% of the entire national caseload concentrated in just three of the 93 field offices in this report.